
Recently we held an exciting webinar on Online Solution for Vegetation Management!
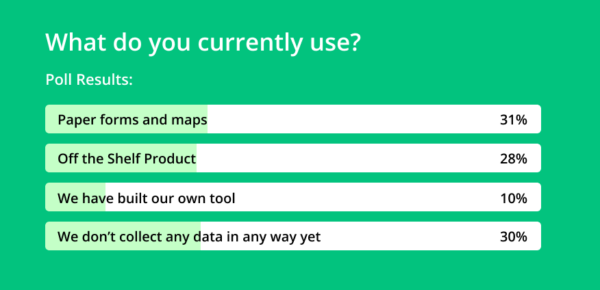
We touched upon some critical pain points of everyday vegetation management workflows and had an interesting poll where we found out that some companies still use paper forms or don’t collect their data in any way yet!
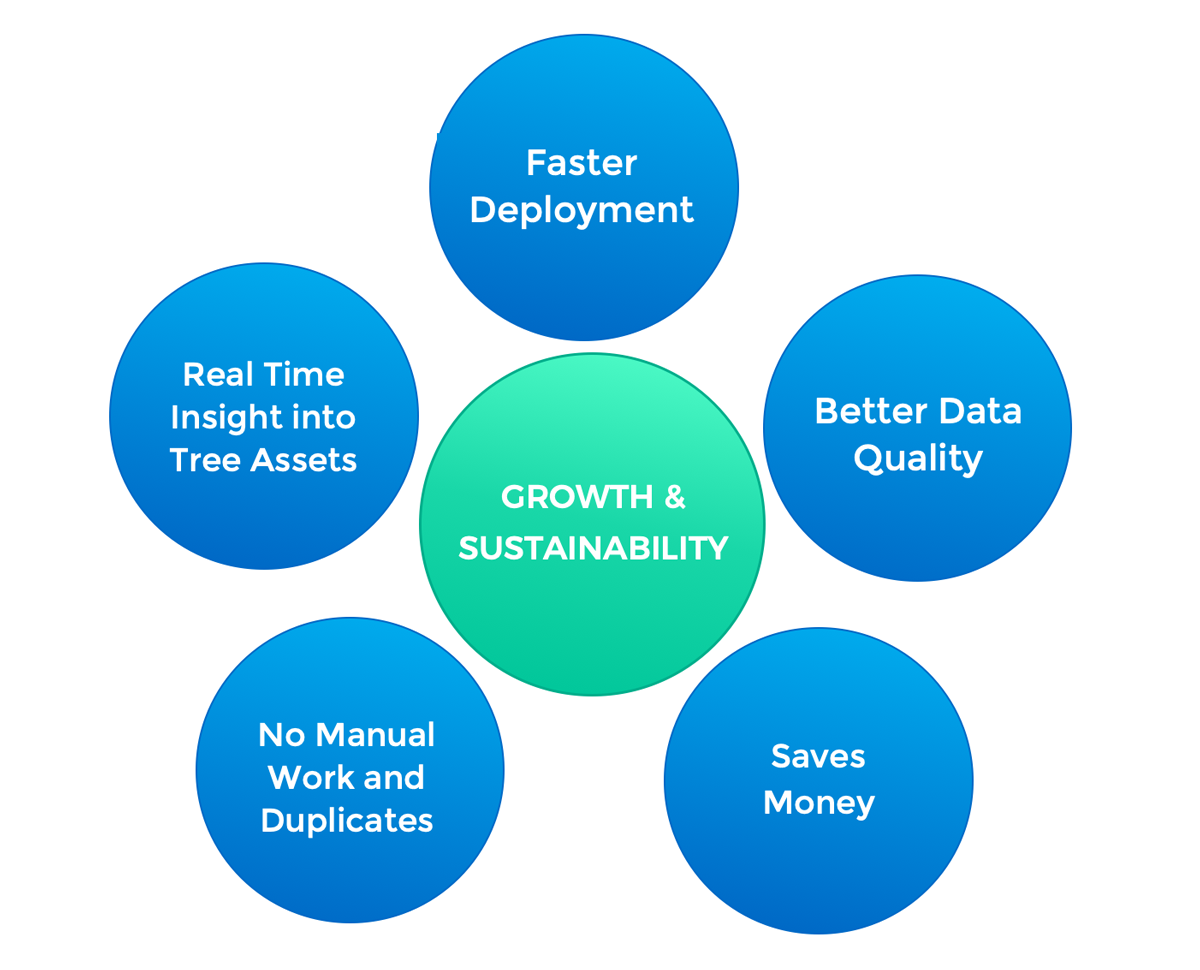
GIS Cloud has been working with numerous companies for vegetation management, which had the same problems in the past. We wrote on this topic in our blog on how to optimize your vegetation management with online GIS. Utilizing our apps and platform revolutionized their workflow, improved communication and collaboration, leading them to make better decisions and cut their costs.
With the digitization of your workflow, you are literally saving the trees and keeping the money in your pocket.
Tree Risk Assessment is crucial for maintaining a safe and eco-balanced environment. Different natural mechanisms, such as storms, wood decay, soil, wildlife, etc., vastly affect everyday workflow and need quick and more efficient disaster response.
If you are facing everyday challenges like:
- Slow and overwhelming paper workflow that is affecting accurate data entry and is by no means acceptable in a case of emergency (storms, wildfires, etc.)
- Inability to share information with relevant teams in the field and in-office which slows down disaster response
- Complicated coordination of teams in the field: who needs to do the job, what has already been maintained, map potential risk areas, operational visibility, etc.
in this specific use case, you will find out how easy and fast it is to classify your data into relevant categories and improve your workflow and management plan.
Collecting Quality Field Data Is Crucial!
Creating custom forms (surveys) in our free Mobile Data Collection Portal web app will help prepare your team for any field project needs. Include important collecting requirements such as:
- Inspection date
- Site Name
- Location
- Species
- Defect
- Hight
- DBH
- Crown Diameter
- Notes/Comments
- Age Class
- Risk Assessment
- Electronic Signature
- Photo
- Media
- and much more…
If you need to collect fallen trees, branches, identify the effects of wind, decay, fire or any other disaster related to trees, the Mobile Data Collection app will ensure your online and offline disaster response on any device in real-time!
All forms are fully customizable and have numerous options like dropdown menus, autofill, select lists, checklists, barcode, etc. Forms can be edited at any time and synced in real-time across all devices.
In case your GPS signal is poor, and you need a precise location for any type of spatial feature, you can use the pinpoint and drawing tools to mark it.
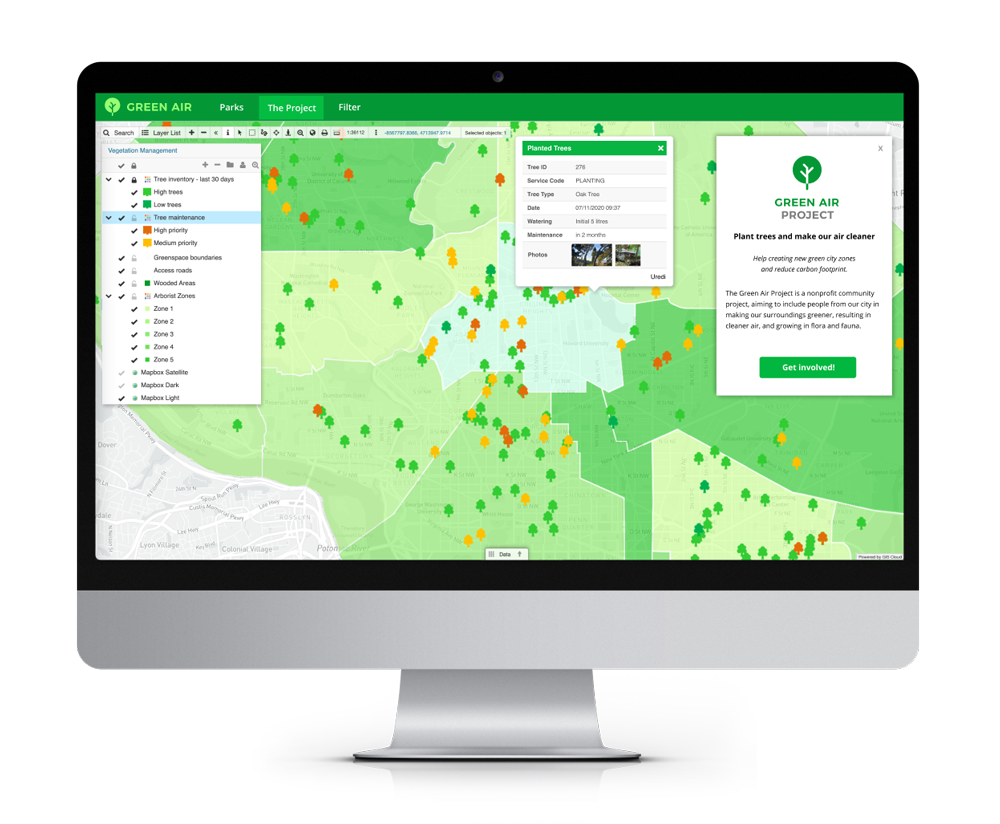
Understanding And Analyzing Data For Smarter Response
There is no better way to understand the data than through an interactive map!
Once you’ve collected your project data in the field, the Map Editor app allows you to analyze the field crew tasks, filter and edit data, and share it with your stakeholders or management in real-time!
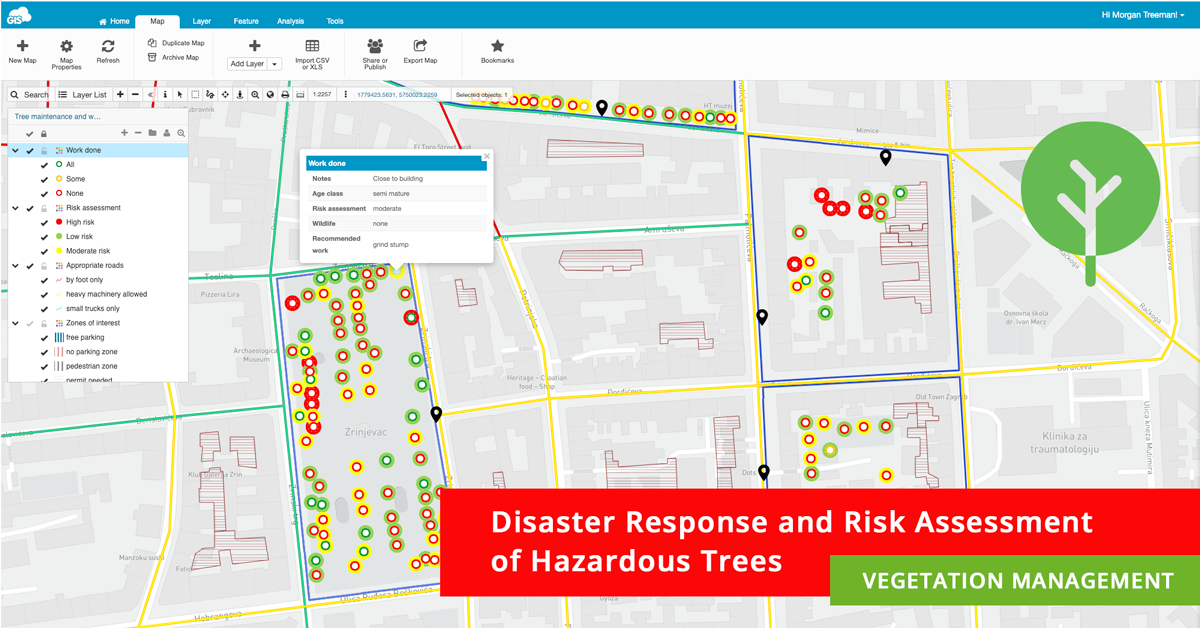
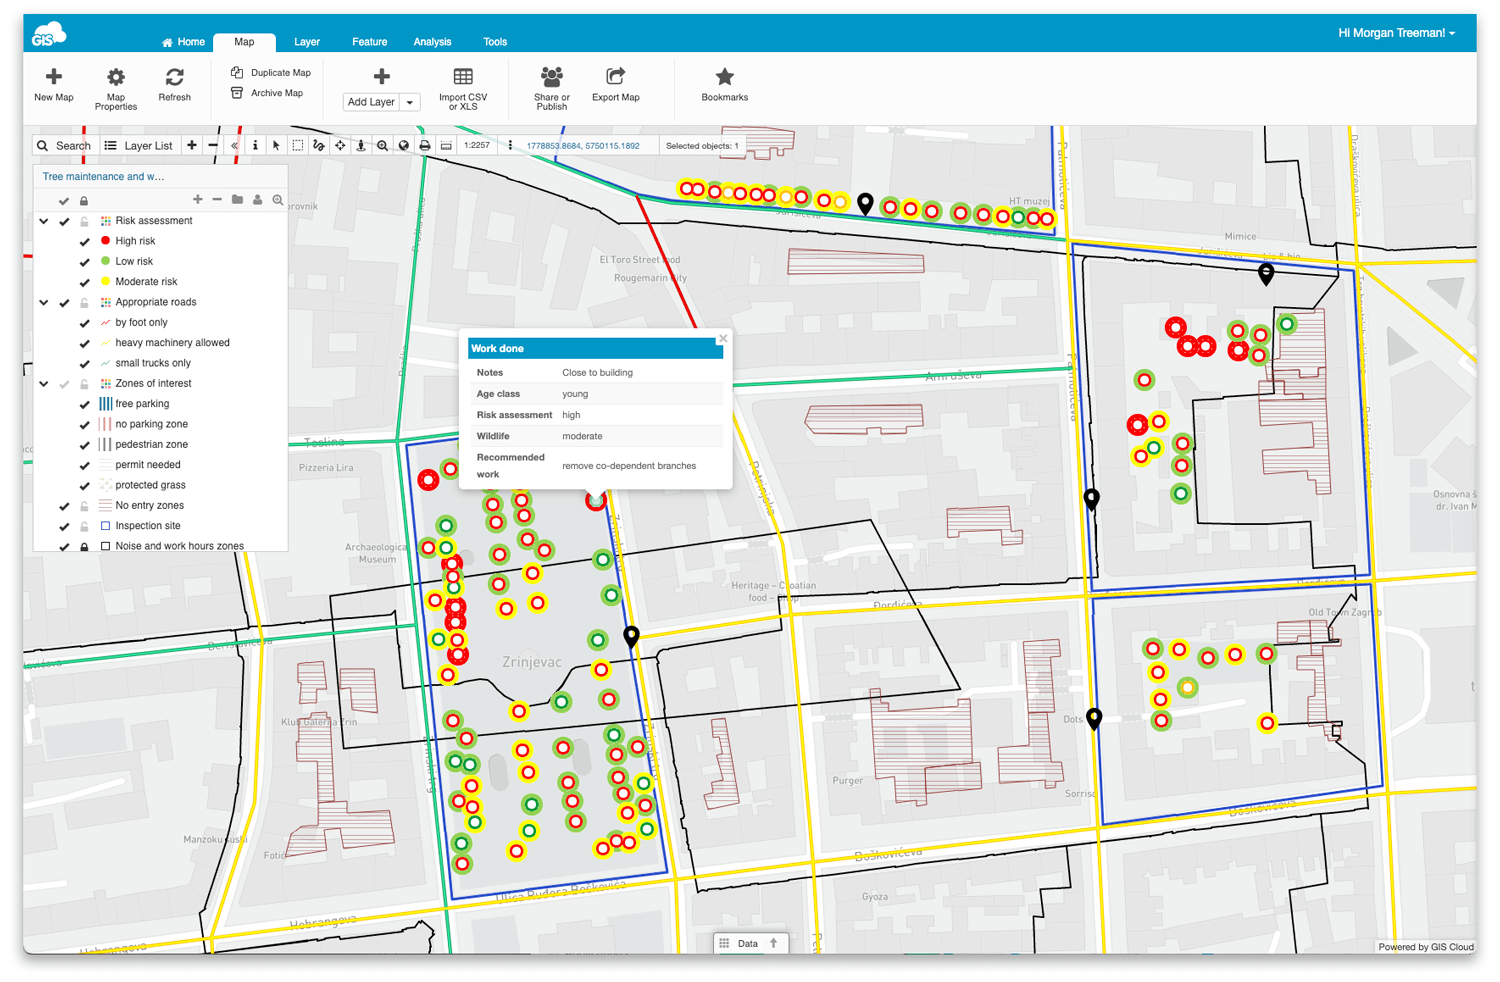
Once you log in, you will see the full scope of the work done with collected data in your hazardous tree risk assessment project. The most important thing is that you can immediately see whether the work is done and what else is there on your disaster response team’s agenda.
Different assets can be marked and color-coded in our Layer List with different symbology. This means that the assets are represented with different colors on the map depending on the category and status.
For example, you can have different types of layers with adequate form data to edit or collect like:
- Zones of interest (polygon):
Type: free parking, protected grass, no-drive zone, no-parking zone, permit needed, pedestrian zone
Description: parking fee is 50$
- Work Done (point)
Type: All, Some, None
- Risk Assessment (point)
Type: High Risk, Low Risk, Moderate Risk
- Appropriate Roads (line):
Type: small trucks only, by foot only, heavy machinery allowed
- Property Entrance (point):
Description: i.e. Owner asked to ring the bell before entering
- Private properties/no entry zones (polygon):
Type: protected area, private residential area
- Noise and Work Hours Zones (polygon):
Preferred work hours: 6am – 9am, 9am-12pm, 12-3pm, 3pm-6pm, 6pm-9pm
Additional information: no heavy machinery
All of these layers can be filtered in the Datagrid to help you understand the current state of the assets better, mitigate any field liability and redistribute the work more efficiently!
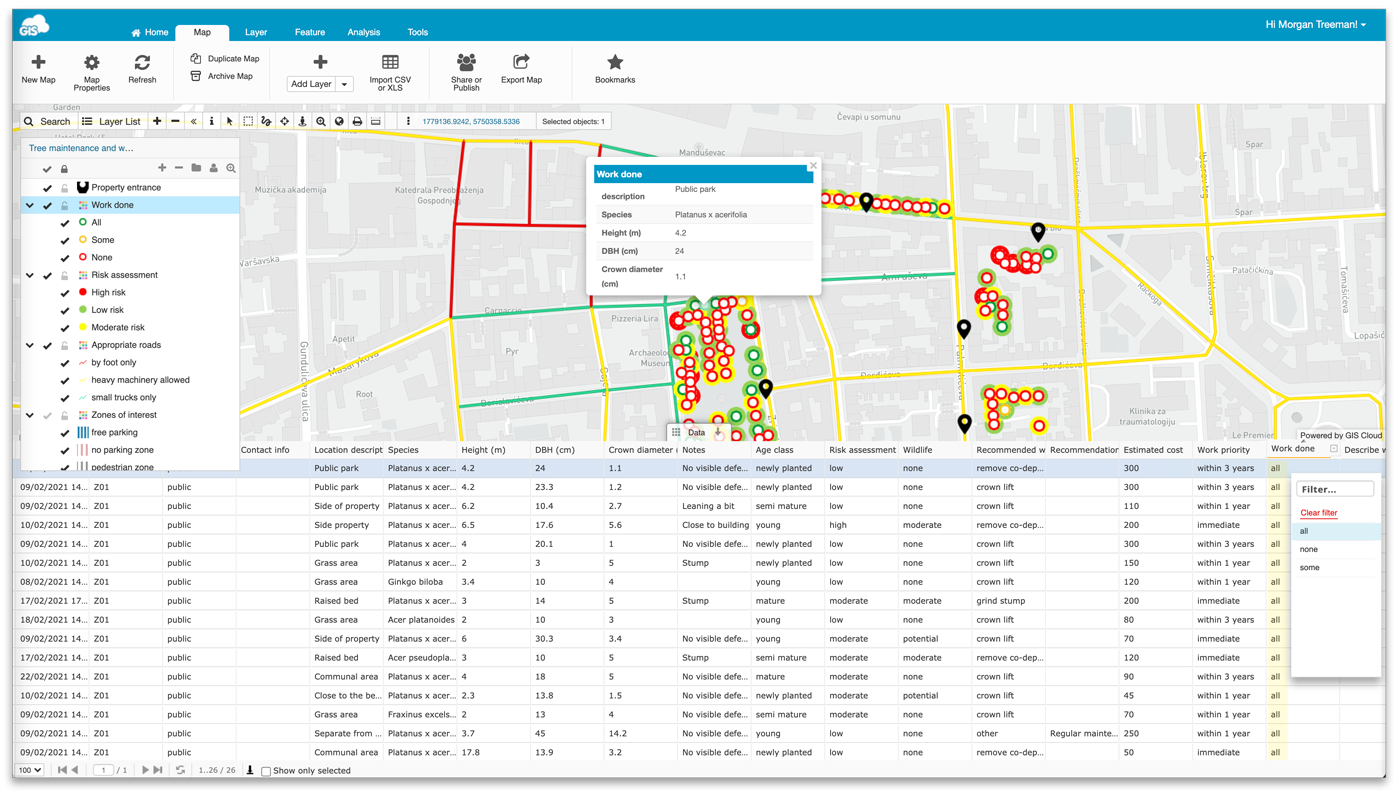
For example, you can filter only the locations where the work is not done. Once the locations are filtered, you can choose each individual tree or any vegetation asset and assign it to your company’s team or individual.
The team or individual will get all of the assigned information he needs in his Mobile Data Collection App, like preferred work hours, what roads to take to the location, whether there is free parking, whether it is a high or low-risk job, etc. Once the job is done, they can select the option in the custom form, and the feature on the map will automatically change the color in real time, indicating that it has been handled.
It’s that straightforward and easy!
Online GIS For Reporting And Sharing
Once everything is set, easy-peasy, on schedule and performance measures are effective, it is time to increase communication and collaboration with the stakeholders.
Using the Map Viewer and Map Portal as a go-to solution will improve many aspects of data sharing and reporting privately and publicly. With just a couple of clicks, present your data to clients, subcontractors, management or the public.
They will be able to search, visualize and explore the data with adequate information and make essential business decisions. Identifying crucial information and pain points will help with cost optimization and customer reliability.
Be more effective, reduce future costs and optimize your tree risk assessment and disaster response!
If you are interested in using GIS Cloud for tree and vegetation management projects, Sign up for the free 14-day trial.

Contact our Solution Consultants to help you set up a desirable, customized GIS Cloud solution for your specific needs and workflow!