

Combining Remote Sensing & Online GIS Technology is the Future of Risk Management in Agribusiness
According to FAO, the growth rates of global agricultural production and crop yields have slowed in the last couple of years, raising fears that the world may not be able to grow enough food and other commodities to ensure that future populations are adequately fed.
Considering climate change as an important factor in farm production around the world, the growth rates of global output may further be endangered by the shortage of rain and the occurrence of natural disasters such as floods and droughts. This is leading to crop failures, food insecurity, famine and mass migration together with negative national economic growth.
This is why risk management is becoming a priority and an important tool in agribusiness for farmers. They need to anticipate, evaluate, avoid and react to the everchanging environmental shocks and thus mitigate risk and uncertainty in agriculture.
Using GIS as risk management and decision-making tool, with the help of data visualisation and maps, is becoming a necessity and standard for numerous agencies, insurance companies and businesses around the world. Digital maps can display spatial correlations and patterns that are difficult to detect in spreadsheet-based reports. Furthermore, online GIS solutions are recognized as a go-to solution for collaboration and communication between stakeholders in farm risk management, namely insurance providers, farmers and governmental agencies.
We bring you a use case regarding agricultural risk management strategies where the insurance company used airborne multi-spectral imagery to evaluate the impact hail damage on corn for the purpose of insurance claim assessment.
Insurance Settlement Goals and Challenges
The insurance company used drone generated NDVI map to have an overview of the hail damage in corn. This was a pilot project designed for improving their agriculture risk assessment process. They needed a solution for field inspection, data sharing and collaboration between the parties involved in an insurance claim case.
Their primary goal was to create a solution combining Remote Sensing Technology with related ancillary data collection within GIS to gain an advanced and accurate tool for assisting with crop hail insurance settlements in minimal time and without conflict, while keeping expenses low. The challenge was in finding the best way for sharing large raster datasets with farmers who had no previous experience in GIS. The insurance company also needed to improve the collaboration process so that settlements could be accomplished more efficiently.
Combining Remote Sensing and Online GIS to Improve the Workflow
A few days after the hail, the insurance company used drones to create an overview of the cornfield crop damage. The area of 660 acres was mapped using MaVinci Sirius Pro unmanned vehicle. 758 images were generated by UAV, using RTK GPS positioning system and near-infrared sensor imagery. The results of drone image processing were orthomosaic, NDVI_rainbow, NDVI_heat and NDVI_gray images.
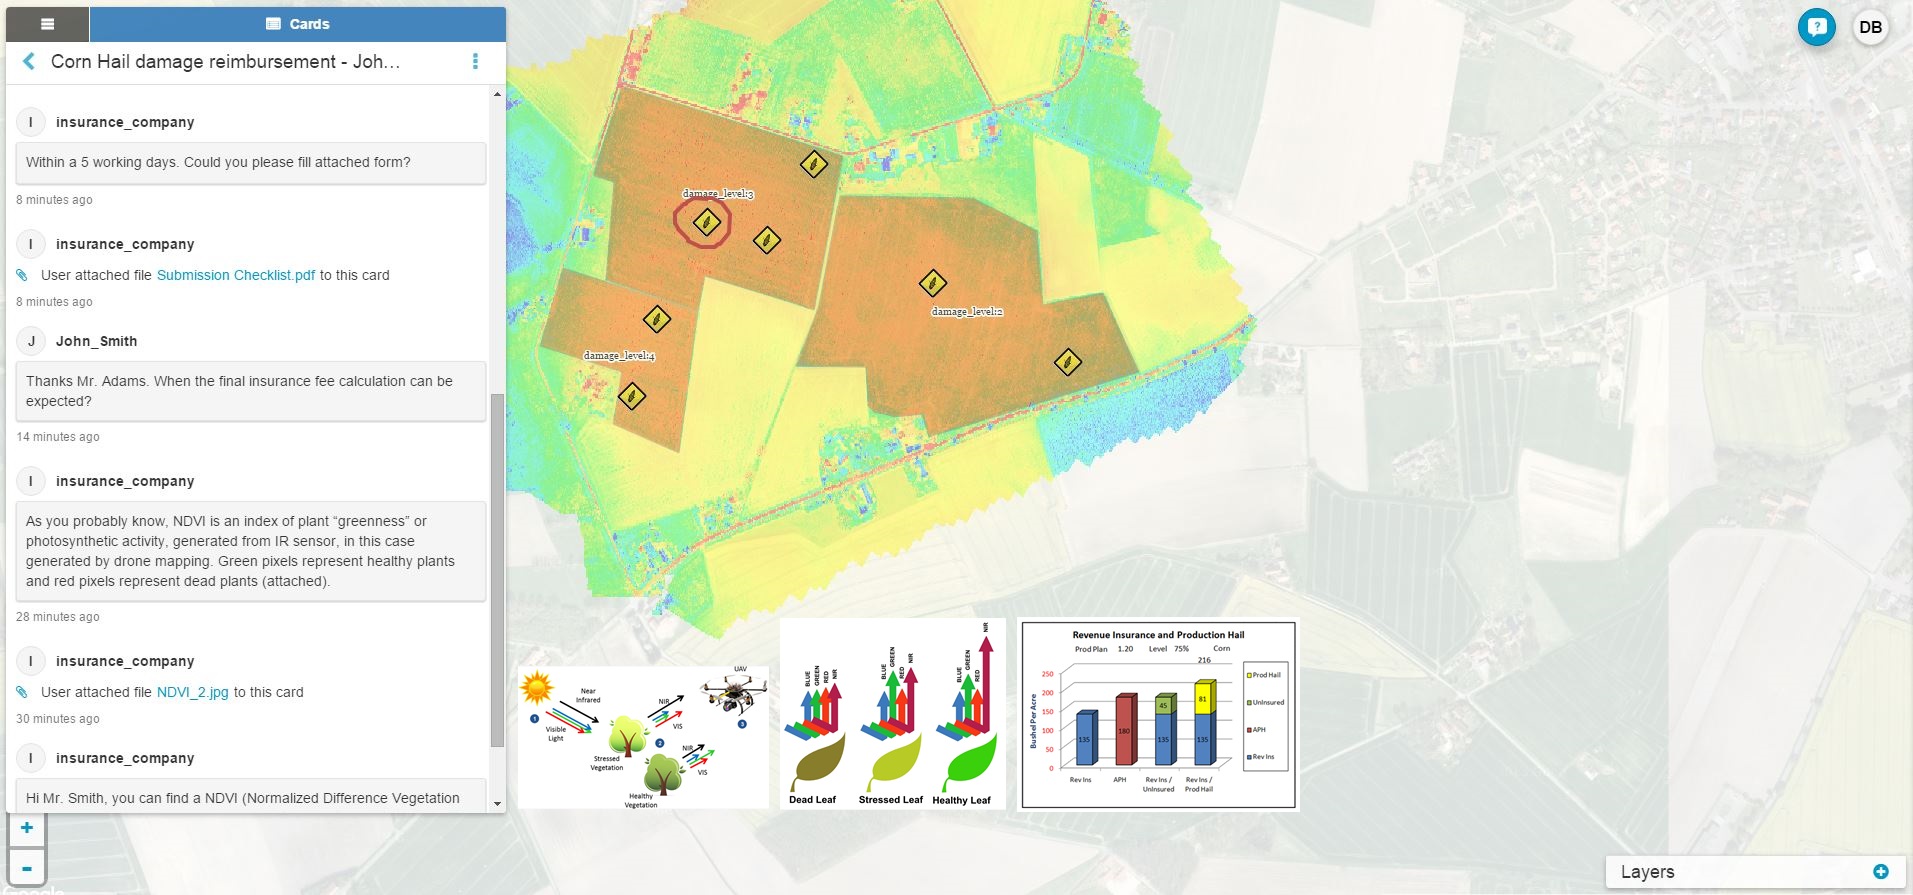
“NDVI or Normalized Difference Vegetation Index is a measurement of the amount of live vegetation in an area and is commonly used for agricultural assessment. The basic principle of NDVI relies on the fact that, due to their porous layers found on their backsides, leaves reflect a lot of light in the near infrared, in stark contrast with most non-plant objects. When the plant becomes dehydrated or stressed, the spongy layer collapses and the leaves reflect less NIR light, but the same amount in the visible range. Thus, mathematically combining these two signals can help differentiate plant from non-plant and healthy plant from a sickly plant.”
Insurance company consultants and analysts can use NDVI data to determine the intensity of crop fields damage by analyzing NDVI pixel intervals using the NDVI map (with a scale range from -1 to +1).
Inanimate or dead material (roads, buildings, soil or dead plants) is displayed in red, while plants are displayed in green, making the hail damaged area easily visible on a map. This analysis helps generate necessary parameters for insurance claim assessments.
NDVI map was of great help for the field inspection process. After processing data, analysts from the insurance company were able to determine which areas require their immediate attention. Data visualization helped them to make the workflow more efficient – they knew where to go and take the samples just from a quick look to a map.
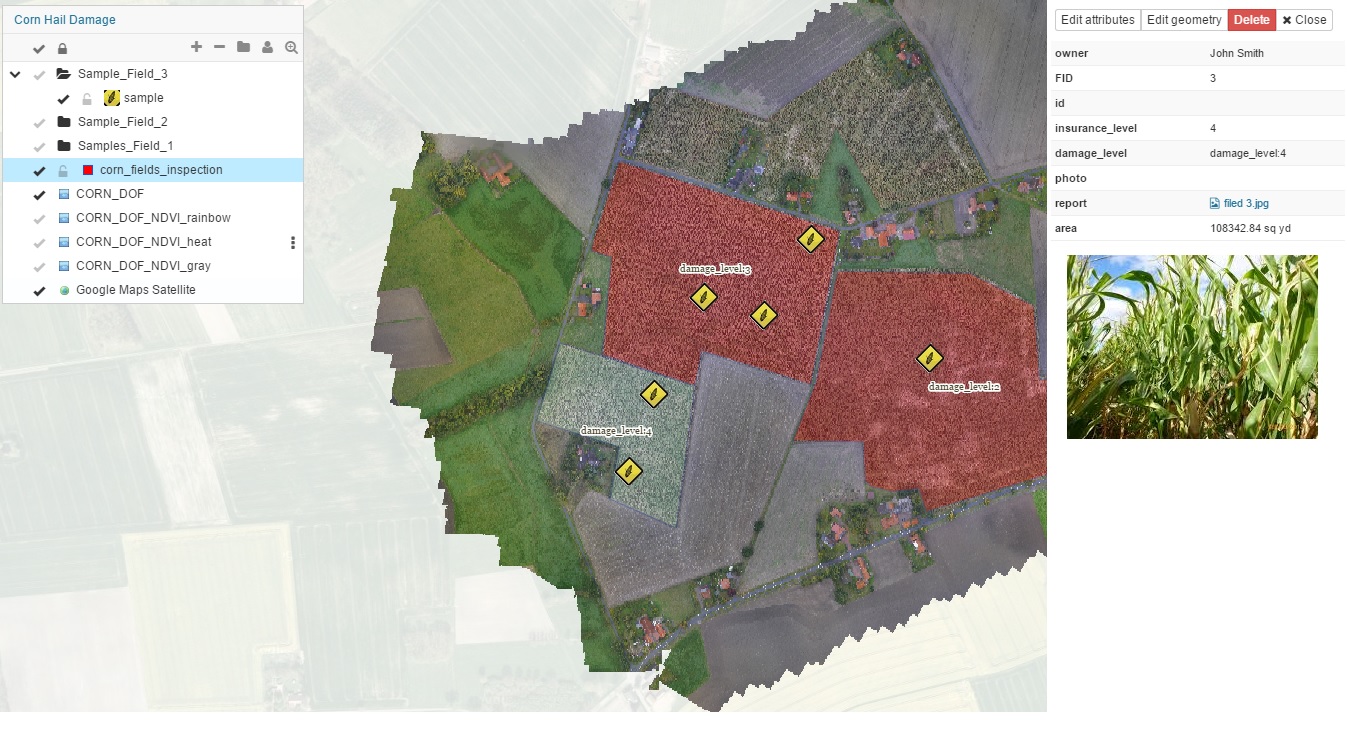
Sensor data was uploaded into different layers through web application Map Editor, making it available online (in the cloud) and therefore easily accessible. The insurance company used polygon layers to mark the insured areas with additional information on insurance levels for each sector, together with damage indexes provided by processing the NDVI data. One layer included the sample data from the field investigation.
Analysts used NDVI map as a basemap for field investigation with the help of Mobile Data Collection application to pinpoint locations where field samples were taken (marked in yellow), including attached field photos with marked locations. These locations were later updated with the scouting results in the form of .pdf, making all of the data available on a web map.
‘Samples’ layer was populated with three types of sample data for each area: red NDVI area (<0.00; dead plants), yellow NDVI area (0 – 0.33; unhealthy plant material) and green NDVI area (0.33 – 0.66; healthy plants).
All of the collected and mapped data was available for private sharing through Map Viewer application. It enabled simple and easy access to data for field crews who were collecting samples in the field.
Preliminary Assessment Supports Proper Decision Making
When the scouting process was finished, consisted of observing the mapping data combined with the field sample inspection, insurance provider needed to verify survey data and create a damage assessment.
When the preliminary assessment phase was finished, insurance provider needed to share the data with interested sides, in this case, the farmer whose crops were damaged and the Agricultural Development Authority providing one-time support to the farmers in the case of hail.
They used GIS Cloud to provide extra information to the sensor and sample data shown on a map containing a base for creating assessment parameters.
This feature was an important part of a better workflow in terms of collaboration. It enabled all of the stakeholders to communicate in real-time on a map, without a need for face-to-face meetings. The methodology was discussed on a map serving as a workboard, where insurance company coordinated their arrangements and provided additional explanations concerning the agriculture risk assessment process.
Collaborative Mapping: An example of using cards to create a workflow streamline for all the stakeholders in a project.
The Benefits of Using Online GIS and Remote Sensing in Agricultural Risk Management
The insurance company offered us the following conclusions:
1. Multispectral imagery (airborne or satellite) is adequate for detection of the ground area and relative level of hail damage in corn for typical American agricultural areas.
2. Drones with integrated GPS RTK technology can provide spatial resolution up to 2 inches.
3. Damage assessment based on airborne remote sensing is faster and more accurate than currently used, field-oriented, hail-damage adjustment procedures.
4. Combination of NDVI map generated from drone images and GIS technology in the cloud is a great tool for the agricultural risk management insurance company.
The key values are:
- uploading big raster data
- using GIS tools such as creating polygons, lines and points and adding attribute data are helpful in improving the data visualization process etc.
- sharing and collaboration functionality
5. With the help of online GIS, all the stakeholders can be easily involved in the process: owner, insurance manager, the local authority for agriculture and others, without a need for specialized expertise in using software
In the abstract, using drones in agricultural risk management provides an easy and efficient way of generating an up-to-date overview of the crop damage. In the case of huge farming areas typical for North and South America, Australia and Eastern Europe, this technology can be used to improve crop monitoring in all phases.
Combination of remote sensing and online GIS technology is an excellent way to create ‘added value’ to the mapping data – both through GIS functionality (polygons, layers, attached data) and data sharing. When you add the possibility of real-time communication and collaboration with different stakeholders and crews on the project, we can add that GIS is exceptional decision-making tool, helping agricultural agencies, agribusinesses and numerous companies to improve their understanding of the data.
If you are interested in using GIS Cloud for agricultural projects, Sign up for the free 14-day trial.
You can also contact our Solution Consultants to help you set up a desirable, customized GIS Cloud solution for your specific needs and workflow!