
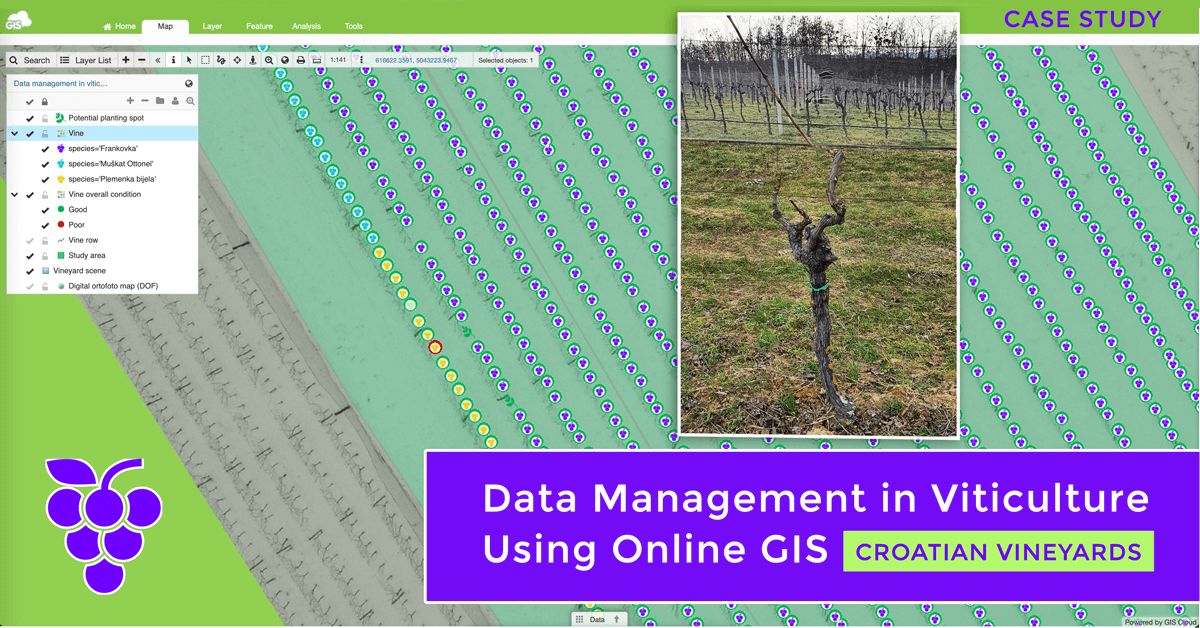
Ana Jantoš a Geography – GIS student from the University of Science in Zagreb wrote this case study to show how online GIS can make a crucial improvement in vineyard management. Besides creating an online database for inventory management and decision making, she states that GIS also helps to identify areas that can have a good impact on the future expansion of viticulture as an activity and a significant increase in production and yields.
Viticulture is a branch of agriculture that involves cultivation and grape production, and as such requires a lot of effort and time. As the proverb says, “The vine seeks a servant, not a master.”
Croatian viticulture and winemaking has a long and rich tradition. In the past, it was of vital importance and thanks to the diversity of climatic and pedological conditions, a large number of indigenous species were developed, which is a special feature of Croatian viticulture and winemaking.
Dealing with culturing vines for my own family needs made me think of GIS contribution to the cultivation and production of the vine. The main project goal was to create a Database along with a map that shows vine species and their characteristics, which are crucial for vine production. Those characteristics are also crucial for easier maintenance and management of the whole process.
Due to an effort to improve viticulture and winemaking, it would be desirable to have a database that could constantly be updated. It is also necessary to improve monitoring of the vine condition and finished work in vineyards.
This can be easily achieved with the GIS Cloud applications. Properly constructed layers with a correct database could be a great help, especially in larger vineyard areas where it is hard to track all of the data for thousands of vines.
Collecting Field Data to Create the Vineyard Map
To create a database and a map, it was necessary to find a way of mapping over 2000 vines in the vineyard. To make the database more systematic, vine rows and parcels needed to be mapped and collected along with the vine data.
The best way to map all preliminary data due to the high density of vines was to take an aerial photograph of the vineyard using a drone which took about 15 minutes. After that, the aerial image of a 0.5-hectare vineyard had to be georeferenced, and the projection was added. Now, the aerial photograph was ready to be added to the map in Map Editor.
The next step was to map each vine and add its attributes and photos in the Map Editor app.
There was another way of mapping the vines which includes the Mobile Data Collection app (MDC). After adding an aerial photograph to the map, you can create a custom form for data collection and link it to the map. In the MDC app, you need to find your form, fill in the attribute data and add photos, and pinpoint each vine to draw a feature on the map.
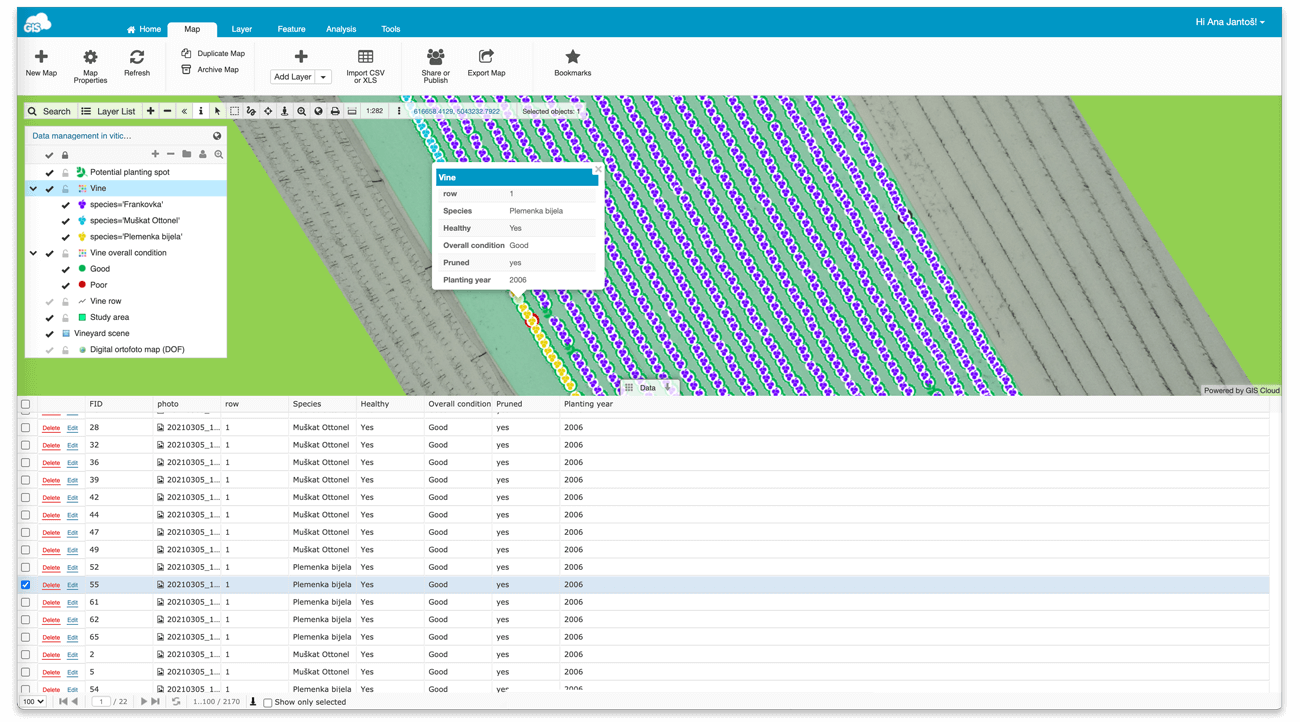
Attributes can be associated with any vine cultivation or wine production data. In this case study, I chose the following attributes for the vine layers:
- vine ID
- vine species
- row
- vine health condition
- overall vine condition
- planting year
- and pruning of the vine
The most common vine sort in this vineyard is Frankovka. The Jukić family is cultivating these vine sorts because of the alluvial and loess soil which is suitable for it. This sort has proven to be excellent for the production of wine Feravino Frankovka and Rose, which exude quality.
Each vine species was marked with the appropriate color by a grape symbol:
- Blue – Muškat Ottonel
- Yellow – Plemenka bijela
- Purple – Frankovka
In order to make the most of the space and bring higher yields and income, I decided to make another dot layer that represents the places of possible planting of new vines. The layer is marked with a plant symbol which in this case represents planting.
In order to make vine digitalization easier, the line layer representing vine rows and the polygon layer of the study area were first created in Map Editor. The vine rows layer has its number and length, while the study area layer has attributes about cadastral data, including the cadastral office, cadastral municipality, parcel number, owner info, and the area.
The study area layer was made according to the Croatian ZIS (“Common land registry and cadaster information system”).
You can also add whatever attribute is relevant to your case. For example, you can add attributes such as fertilization, type of vine disease, applied chemicals for disease treatment, the date and time of collecting those data in the field, pictures, voice recordings, etc.
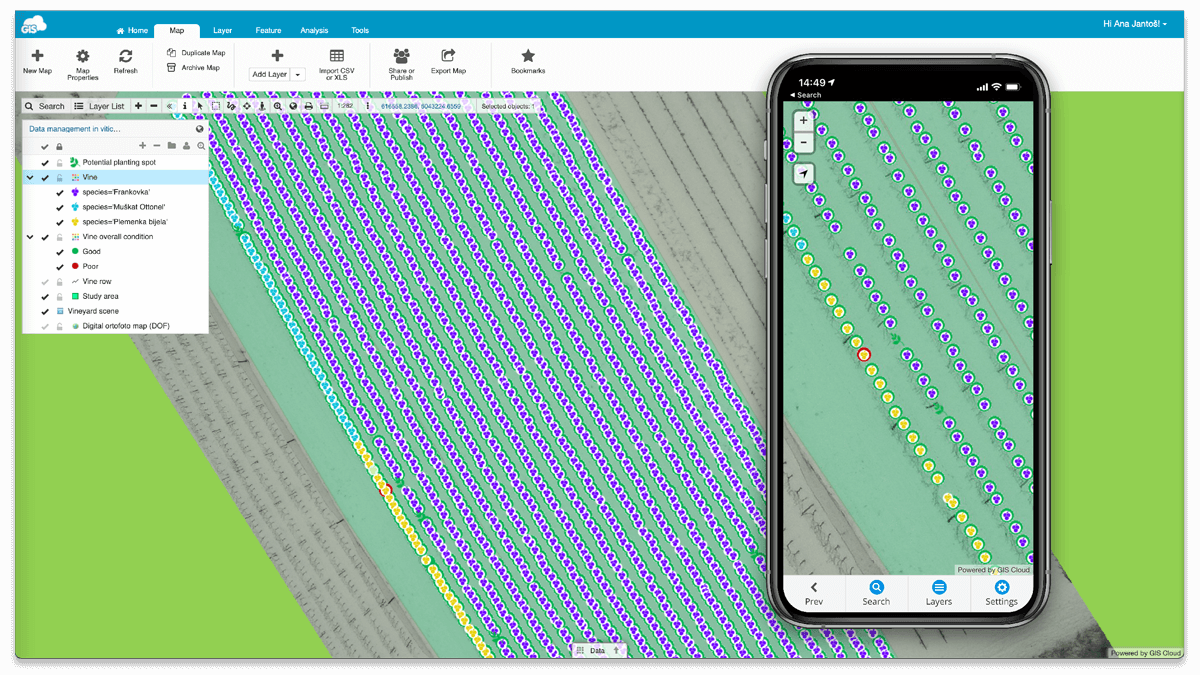
Displaying Data in a Custom and Branded GIS App
If you want to display your data through a customized interface, the Map Portal app is a great way to do it. The Map Portal is a custom GIS application that enables easy displaying of your mapping data to the public. It is a good solution as it reduces effort, paperwork, costs and saves time.
The public map enables viewers to visualize, search, and explore presented data. It also provides access to maps on any device, smartphone, tablet, or desktop at any time.
One of the Map Portal characteristics is that you can make a personalized logo and domain, but also custom user interface and tools. This is a great way to gain an insight into specific information or learn something new. This is very useful in industries where employees work in a particular area, as they can see what jobs need to be done or which have already been done by their colleagues.
For example, in this case study, you can see the health condition of the vines. Further examination should be made for unhealthy vines, and specific treatment methods must be applied. People in charge of treating vines will be able to access the data easily and know the exact locations of the vines which need to be inspected.
Benefits of Using Online GIS in Vineyard Management
Creating an adequate database with the following layers and the map can significantly improve and systemize data. The GIS Cloud apps enable fast and easy creation of maps and datasets that can be published or shared with certain people. Most of the work that needs to be done in vineyards can easily be recorded and tracked with either the MDC or Map Editor app.
Maps are an excellent tool for a better representation and observation of specific phenomena than the data in tables. For example, mapping and analyzing vineyards allows us to see things from a different perspective, so I noticed areas that would be suitable for planting new vines.
Spatial data (with its coordinates) stored in the application gives us precise locations of the vine that needs to be pruned, treated, and fertilized, all without remembering which row and number of the vine are in question. All it takes for the application to contain all the necessary information is to enter the vine location with the following data in the app immediately in the field.
In addition, it would be possible to add attributes that would represent the number of grapes harvested in a row, parcel, etc. throughout the year and the amount of wine produced per year. Those data could be used for further analysis of yields and income over a longer period of time.
Databases give information on all types of vine characteristics, which were collected and recorded in the field, closely connected to the location, making work and data management easier. The database can be constantly updated and new data can be added. The important fact is that the older data can also be archived, and stored online.
The GIS Cloud applications are quite intuitive and could be used by users who encounter GIS for the first time. Using GIS in viticulture can be a good practice that can make things easier for you. It is simple to use and helpful for mapping and analyzing data.
One of the most useful advantages is the automatic saving of data, so you would not be concerned whether the data is lost, you forgot to save it or your device ran out of battery. This way, you save your time, money, and it is more environmentally friendly because it does not require a lot of paperwork.
If you manage a vineyard and need a simple and fast, but reliable solution for tracking vine health and needed jobs, Sign Up and try GIS Cloud for free, or contact GIS Cloud to help you find the best solution.