
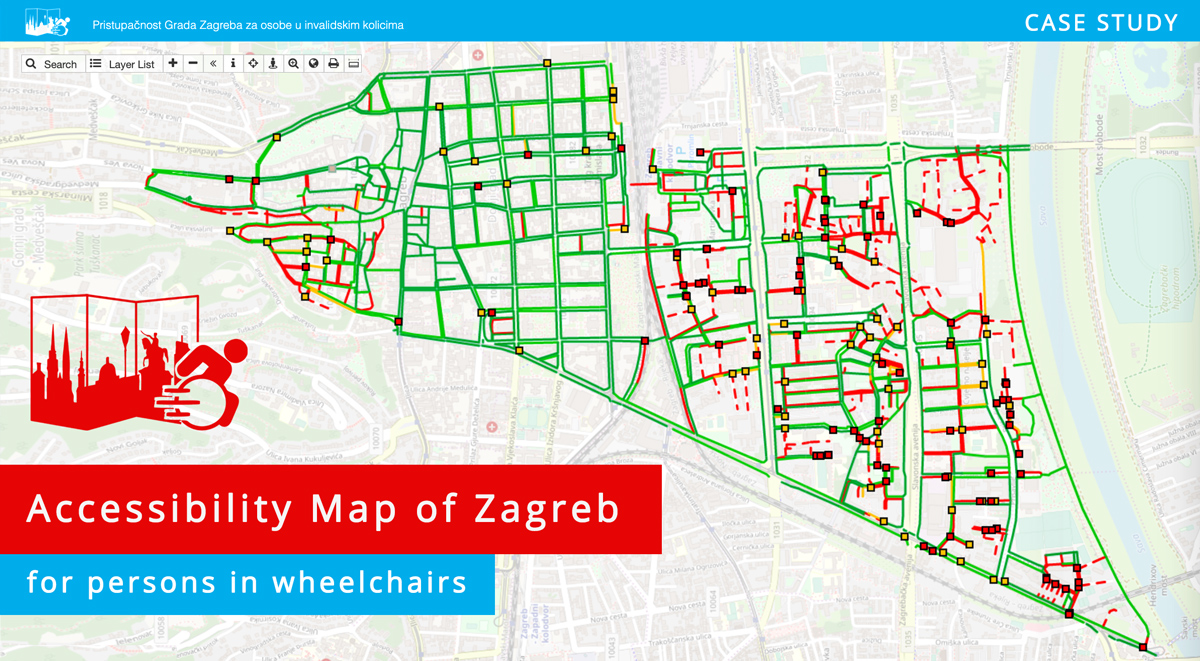
The main project goal was to create a map that shows sidewalk accessibility and wheelchair obstacles in the center of Zagreb to help people with disabilities. The case study also shows how mobile apps helped the Department of Geography to transform a paper-based field workflow into a digital one.
People in wheelchairs face numerous difficulties when moving in the streets, such as high curbs, stairs, steep slopes, narrow or crowded sidewalks and sidewalks with damaged surfaces. All which makes it very difficult for them to move freely. Due to improper infrastructure, they often find themselves in situations where they need help from one or more persons, which discourages them from moving independently in the city.
That is why the Department of Geography at the University of Zagreb started this project. The fieldwork and mapping were coordinated by Andrijana Horvat, a geography student, and Neven Tomečak, a student in a wheelchair. Professors Laura Šakaja, Ružica Vuk, Ksenija Bašić and Zoran Stiperski, acted as project leaders and supervisors.
You can explore the Accessibility Map here >
Project Implementation
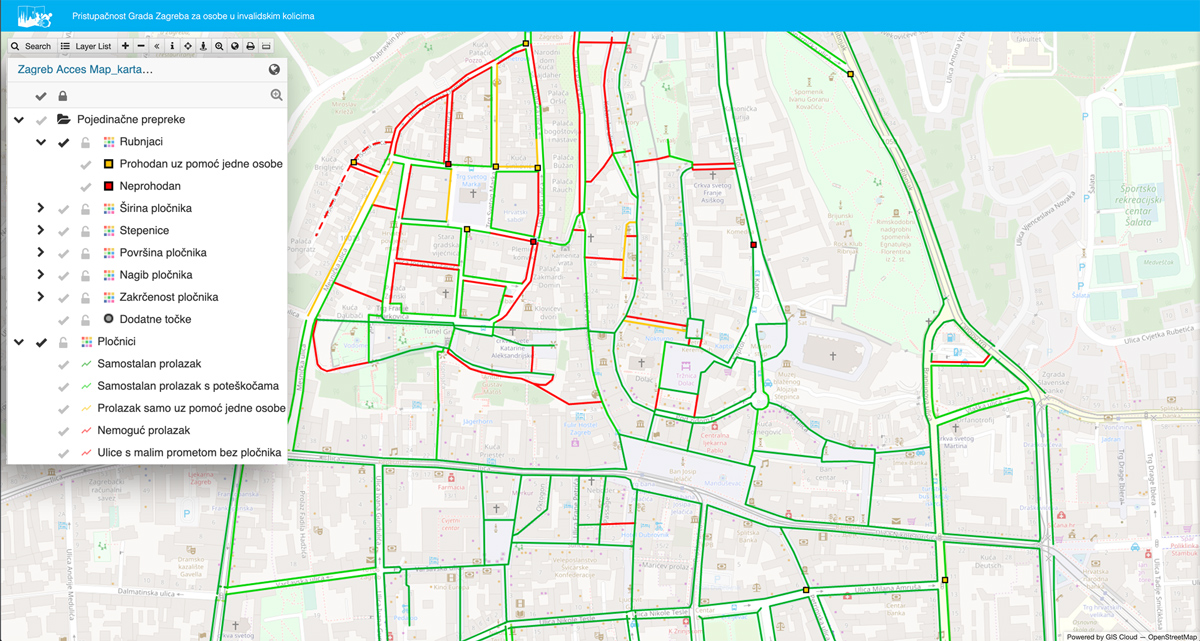
To create a map, it was necessary to survey the given area in detail, for which eight students from the Department of Geography and eight students in the wheelchairs were engaged and divided into pairs. In a given area, each pair needed to evaluate every segment of the street (bounded by intersections) according to the given criteria: width, stairs, curbs, surface, slope, and crowdedness of sidewalk.
Each criterion was appropriately rated:
- 0 (self-passing),
- 1 (self-passing with difficulties),
- 2 (pass with the help of one person),
- and 3 (unable to pass).
By examining the mapping results, it was found that there were significant differences in the evaluation among the groups. So one pair of students was selected to redo the entire area and equalize the grades.
In the meantime, there was an idea to present the research results through a web GIS application that would make it more convenient for users. It was decided to collect and visualize the data with the help of GIS Cloud apps. The initial mapping setup when the data was collected with paper forms and then manually uploaded to desktop GIS was time-consuming and tedious. The GIS Cloud apps enabled a lot more efficient data collection, analysis, and map creation.
Collecting field data – lines and points
Before going into the field, it was necessary to prepare the collection forms. In the Map Editor, one form was created for line objects that represent street segments, as well as attribute fields which represent the criteria, general score, and photo upload. Another form was created for pedestrian crossings that were collected as line objects with the general score field and additional notes. Also, a point layer was created for the sidewalk obstacles. The attributes assigned to points objects were: type of obstacles, barriers rating, photos, and additional notes.
To collect the data, they utilized the Mobile Data Collection app and their smartphones. The ‘collect lines and polygons’ feature was of great help for ‘drawing’ line segments (sidewalks and especially pedestrian crossings) that could not be detected from Open Street Maps. The app made the field workflow feel like a breeze in contrast to the old paper-based one because the collected data instantly populated an online map in Map Editor.
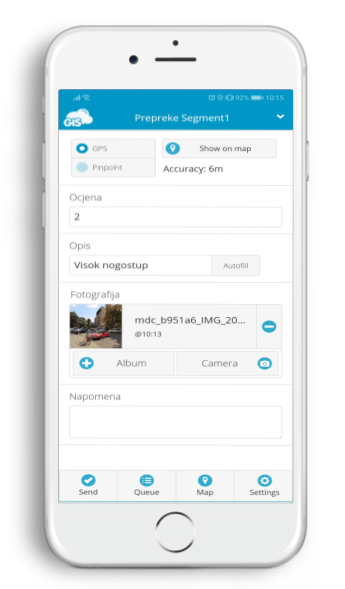
“The MDC and Map Editor applications accelerated the work and provided a better way to collect data than the classic paper-based workflow.” Andrijana Horvat
The greatest advantage of using these applications is that the field data was immediately available in the Map Editor and ready for further processing. Because of that, a long and complicated process of digitizing data from paper forms was discarded.
Creating the Web Application
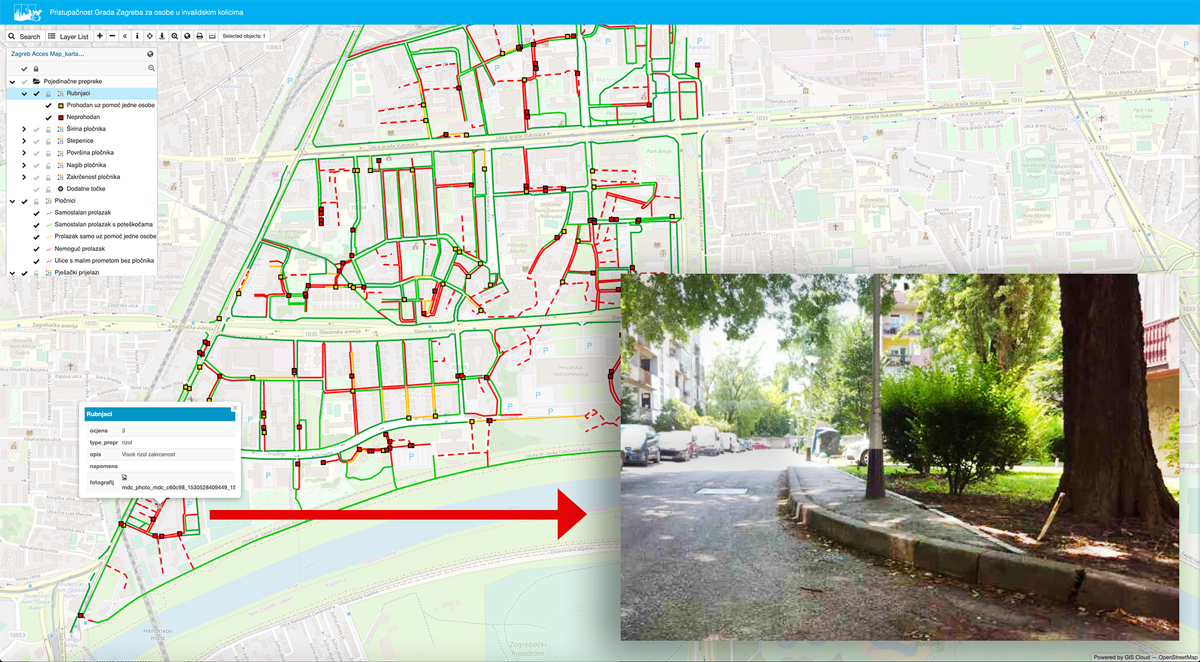
The Map Portal application allows you to easily convert your map to a web GIS application with a custom user interface that can be created in a couple of hours. The app enables users to plan their way through the city and have an insight into all the obstacles they might encounter. Also, every line (sidewalk) and dot (obstruction) provide more detailed information about each criterion and picture.
Creating a map portal in 3 steps:
- 1. Create An Instance And Choose The Domain
- 2. Add A Map And Customize The Toolbar
- 3. Add Custom Tools To The Top Menu
To learn how to create an online GIS application with Map Portal, take a look at this walkthrough.
The Results
The accessibility map gives a clear insight into the infrastructure of the city for wheelchairs and can be an excellent starting point for implementing change because it indicates the problematic areas where the city authorities should intervene and solve problems. The next step is a project that will expand the accessibility map to other city areas and empower people using wheelchairs.