
When waiting at the tram station, it can be bothersome if you don’t know when the next tram comes. Some tram stations in Zagreb, Croatia have a digital display showing information about arriving trams (their line number, direction and the estimated time of arrival).
Geography student Matija Ostović decided to explore which tram stations in Zagreb have an information display or other assets, and create a Map Portal to help citizens get by in the city traffic jam, also alerting city services on needed actions.
Collecting field data with a smartphone
The ideal solution for this kind of fieldwork is to use Mobile Data Collection as it provides a fast and straightforward collection and inspection functions. Further analysis of collected data can be done in Map Editor.
To collect information it was necessary to tour the tram stations of the observed tram lines. Assets included in the mobile survey were the existence of displays, shelters, benches and the map of all tram lines at tram stations. Tram stations with benches or displays were categorized by its condition and maintenance necessity.
The first step was to create a collecting project with an appropriate survey form in GIS Cloud web application. It is important to emphasize that the form and structure of the project can be easily changed in every moment.
The next step was to collect the data in the field using a mobile survey; for all the stations on tram lines 5, 6 and 8, that is 128 tram stops altogether. Those tram lines were chosen because they spread in all directions and include the busiest part of the city as well as the wider city center. The collected data also includes photos of tram stations provided by an advanced tool available in Mobile Data Collection.
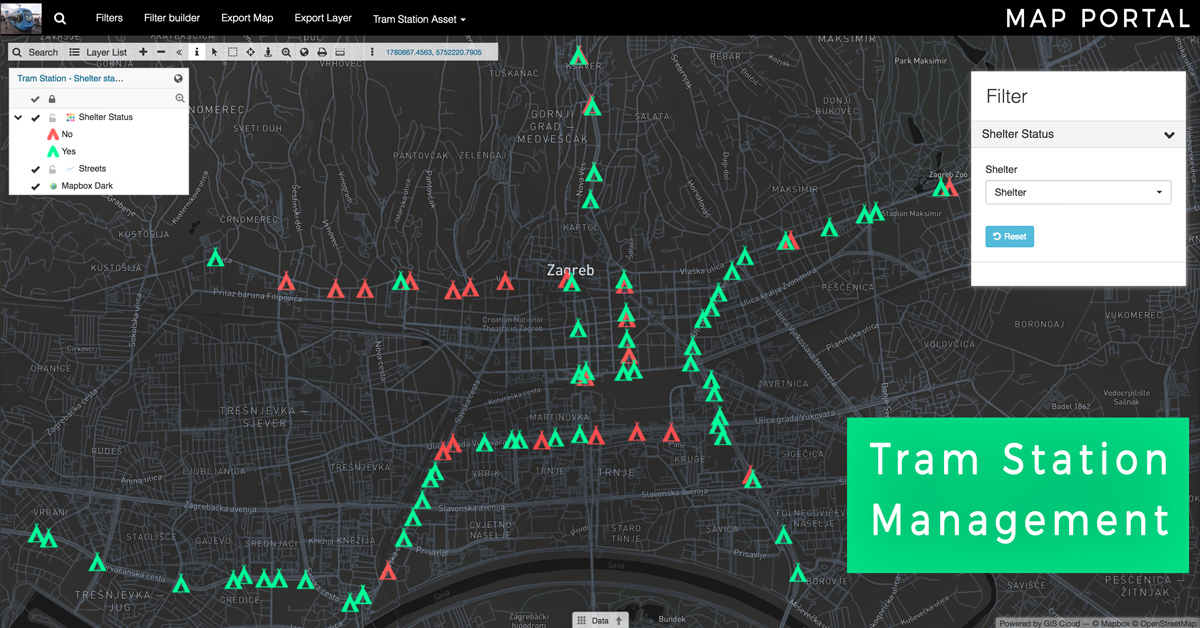
Visualizing the tram station data on an online map
Fieldwork took about 20 hours, and after the data was collected, it was edited and visualized in GIS Cloud Map Editor. This application allows you to classify data by a particular attribute and display the differences between features in the map using different symbology. In this case, the goal was to have a simple overview of the classification by many attributes, so the perfect solution was the use of GIS Cloud Map Portal, where you can publicly display interactive maps. Using App Builder to create a Map Portal, it is possible to display up to 5 maps in a single portal, and quickly switch between them.
For this use case, we enabled switching between 4 different maps:
- map of displays
- map of shelters
- map of benches and
- map of bench condition.
It is now easy to see which kind of asset is available at a particular tram station.
Click here to open and explore the Tram station Map Portal.
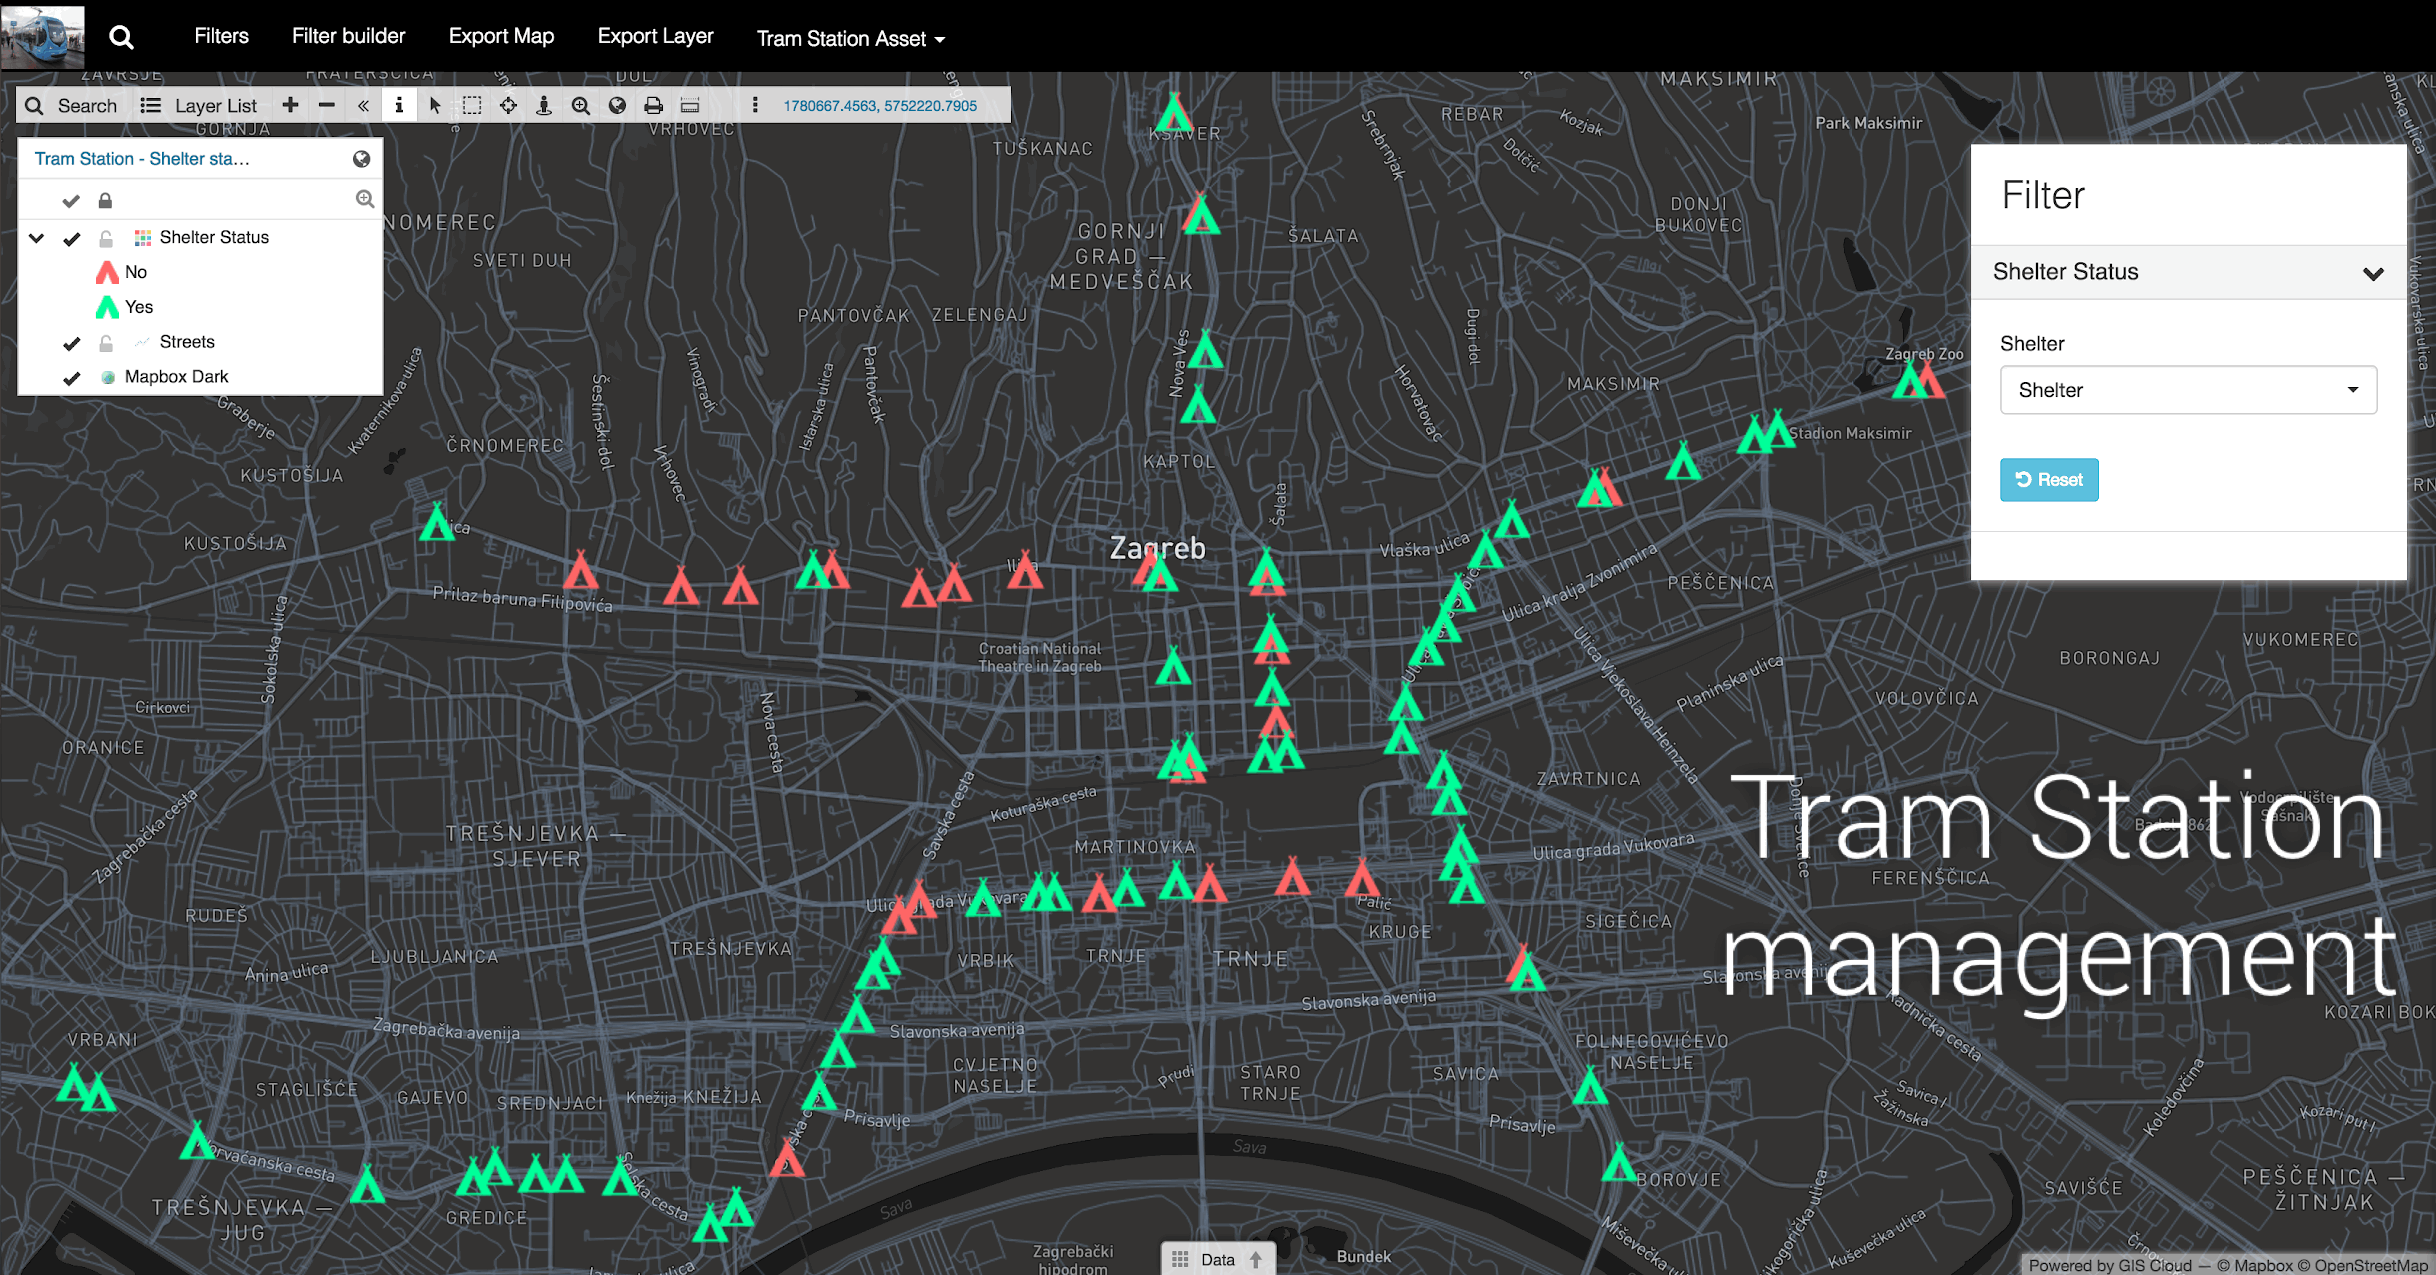
Further on, in the Map Portal it is possible to filter features with the same values of an observed attribute on the map, e.g. in this case you can use filters to show only tram stations with a digital display, or only tram stations without displays. It is fast and easy to set up in Map Portal using filter builder tool. One more benefit is that you can make your maps publicly available with the Map Portal and also you can brand your app by setting the logo and a custom color of the ribbon toolbar using the App Builder.
The condition of tram station assets
Some tram stations lack various assets. The worst situation is in the area between the main city square and Črnomerec, the final station on tram line 6, especially at the stations Slovenska, Mandaličina and Sveti Duh, where no additional assets are present. There is only the old pole with information on which tram lines pass through that station.
Also, a concerning fact is that the tram station Zagrepčanka, situated on a large crossing between the Avenija Vukovar and Savska cesta, has none of the extra features; neither a display nor a bench nor a shelter in both directions. People are often nervous when waiting at the station Zagrepčanka in direction east (lines 3, 5 and 13) because the trams are less frequent and people wonder whether it is better to keep on waiting for the tram or to go on foot.
The map of the tram stations with information about their assets can be useful for many Zagreb tram users, but also for the organizations responsible for maintaining tram stations. It allows them to see what they need to add, repair or replace to improve tram station conditions.
Collecting data required a lot of effort because it was crucial to make a trip around the whole city, but the GIS Cloud Mobile Data Collection made the work a lot easier. GIS Cloud apps are user-friendly, and anyone with basic IT knowledge can learn how to use them.
To learn more about GIS Cloud for Roadworks watch this webinar recording on solutions for roadworks infrastructure and maintenance.
Interested in trying GIS Cloud solutions for traffic asset management? Contact us or sign up here.