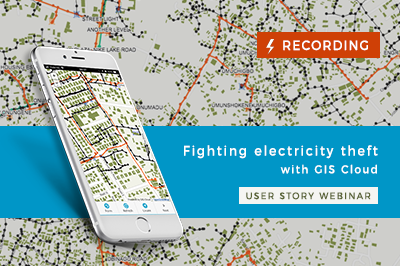
Electric utility companies across Nigeria struggle with electricity theft. The illegal connections to the power grid generate huge losses and are a hazard for locals. GIS technology can help mitigate the problem by enabling real-time insights and proper electric network visualization.
Learn how Enugu Electricity Distribution Company utilized GIS technology to tackle electricity theft in Nigeria.
Complex problems demand versatile solutions
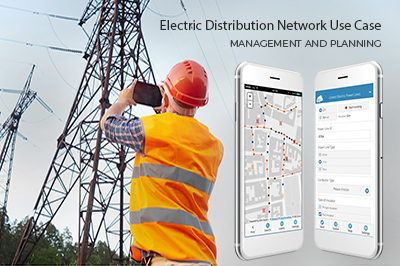
GIS technology is widely used in the field of electric utilities for a range of purposes, from electricity network visualization and real-time insight into the status of the assets to risk management and the efficient resolution of customers’ problems and requests.
Knowing that the electricity distribution system comprises of kilometers of power lines connecting the end users to the substation, it is very important to have the network properly visualized.
This can help with locating issues with connectivity or power outages, as well as with optimizing the usage of resources and identifying sources of energy loss. Customer indexing or enumeration, on the other hand, enables better customer service related to this issue and helps with monitoring consumption in the particular area.
This use case demonstrates the benefits of GIS Cloud for mapping both electricity network assets and customers (customer enumeration) in real time.
The electricity network mapping project
We spoke with Enugu Electricity Distribution Company (EEDC) from Nigeria, who have told us how they utilize GIS Cloud to efficiently map their network and improve their decision making process in their project: “Assets Registration & Customer Enumeration”. They are distributors of electricity for five Southeastern States of Nigeria: Abia, Anambra, Ebonyi, Enugu and Imo State.
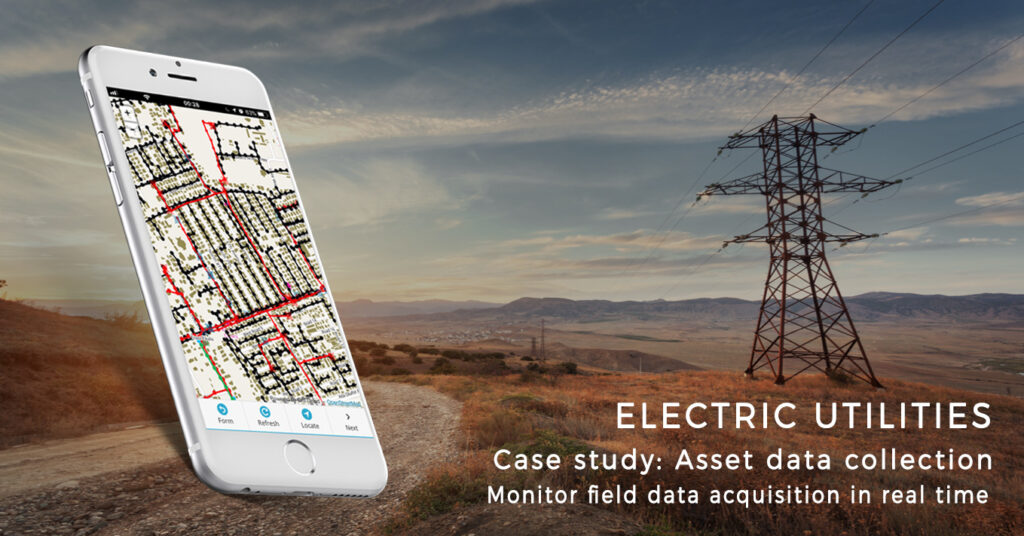
The primary goal of the project was to conduct mapping of their entire electrical network system (asset data collection). Each part of the infrastructure needed to be registered on a map. For the data collection part, they hired three different vendors to do the fieldwork.
The asset data collection part of the project required collecting a GPS coordinate for each:
- transmission substation,
- injection substation,
- distribution substation,
- transformer,
- high tension and low tension pole
- and other parts of the infrastructure.
The GPS location of each asset also needed to include additional data such as photos, status, height (for electric poles), and other data. The end result needed to be a usable spatial model of their electrical network, showing the status of assets in real-time.
Customer enumeration
The other part of the project, following immediately after the “Assets Registration” part, was customer indexing. The EEDC needed to enumerate the electricity consumers associated with each transformer in their network.
Customers are identified using a numeric code. After getting their location, they can be connected with the injection substations and electric poles.
Challenges in preventing electricity theft
The main reason for starting the project was to prevent the electricity theft. Illegal connections to the network coming from households that were not in the EEDC billing database. The billing database also needed to be updated because of the change of the EEDC ownership from the Government to private investors.
Ultimately, the EEDC wanted to reduce the Aggregate Technical, Commercial and Collection (ATC&C) loses. For this, they needed to register all the assets and evaluate their condition. Customer enumeration was important for updating the billing database.
The information EEDC had to start with was too old, so it was important to them not only to get current data, but also to have an overview of the data collection process in real-time. As the data collection crews needed to make estimates of the asset condition to give a cost estimation for maintenance and repairs, having real-time insight into the data collection was needed for making this process more efficient and the data quality better.
So, the main challenge was not only to find a simple tool to collect the data on substations, transformers and poles (GPS coordinates, photos, status, etc.) in real-time but also to communicate the feedback on data collection easily. This was especially important because they had three different vendor companies working for them on data collection process.
What they needed was to have a single tool for collecting data, as well as monitoring and coordinating collection activities. The tool they needed would be used not only for decision-making on top of collected data, but also for communicating those decisions in real-time, both with the field workers and the Senior Management.
Namely, they needed a solution for each part of the workflow.
The same tool would be used for the second part of the project, the customer indexing (enumeration process).
As there are many stakeholders involved in this process, it was important to optimize and manage costs and resources involved in mapping a large and a complex infrastructure.
One solution for the entire workflow
The challenges of finding a solution for each part of the workflow, including efficient data collection in real-time, visualizing and monitoring results as well as communicating feedback, and sharing data to stakeholders, were easily solved with GIS Cloud.
They used the Mobile Data Collection application to collect data on substations, transformers, and electric poles, as well for the customer indexing purposes. The data was collected using simple data collection forms that required no additional training for the fieldworkers. They were able to collect data such as asset type, photo, and assess its condition and send it using their mobile phones and tablets directly from the field.
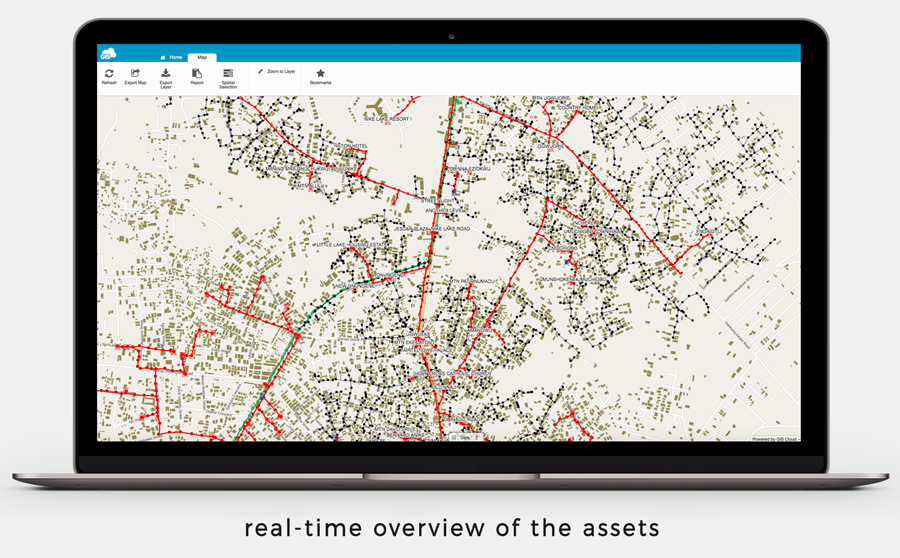
The collected data was instantly visualized in the Map Editor application, resulting in the spatial model of the electric network assets and customers. Information for each electric substation, transformer, and pole appeared on a map as the data was collected. This allowed them to make their workflow and decision-making process more efficient as the coordinators were able to assess the quality of photographs in real-time and coordinate and guide teams based on collected data and by watching their movement in the field. The data could be further edited, including changing the information, adding custom symbology, different layers etc.
Also, Map Editor provided a good way to manage permissions for each user, or a user group (some users had permissions only to collect data, some only to view, edit, or export data).
The feedback was easily communicated using the Map Viewer app, which also enabled them to share data easily with the stakeholders in Senior Management. The stakeholders were able to view the data in the cloud using a simple branded interface with custom options, and access it anytime, from any location.
Cost optimization – pay only for what you use
Each of these applications can be purchased separately, for any number of users, which was important for the optimal cost management because there were many sides included in the process.
GIS Cloud offers a flexible pricing structure in which customers can pay only for what they use (only data collecting, viewing, or editing), and for the period they need it.
So, with GIS Cloud, not only was EEDC able to find a perfect solution that included each part of their workflow and enabled decision-making in real-time, but one that also proved to be a very cost efficient solution.
Interested in learning more about how to use GIS Cloud for Electric Utilities? Watch the GIS Cloud for Electric Utilities webinar recording where you can also see a live demo of the apps.
Learn about further possibilities of the GIS Cloud platform visiting Crowdsourcing product page.
If you want to try it for yourself, sign up here.