
As we all know, Coronavirus is quickly spreading globally, and organizations and communities need to consume a lot of geospatial data changing from one minute to the other, to understand the patterns of the pandemic, and to plan how to organize staff and contain the virus.
In the last couple of days, some of our users and partners reached out to us and told us they would like to help to contain the spread of Coronavirus, and they believe they can make a difference with the help of GIS Cloud technology. As most of them already had a project in mind, we decided to help right away by providing them with our technology for free.
Seeing how GIS Cloud technology can be of great value to anyone working with spatial data related to Coronavirus, gathering information directly in the field or making strategic decisions, we want to extend our help to the entire GIS Cloud community, to anyone who has a good project already in place.
Send Your Project Proposals to Get our Support
Please, send us your project proposals regarding the Coronavirus, let us know how our technology can help and what do you need to start as quickly as possible, and we will
help to get your project going.
Fill in this form – tell us about your project
Projects can include anything from mapping new cases directly from the field, together with all relevant information and images, to representing data via an online map, or an online public Map Portal. The difference between a simple map and a map portal is that you can include multiple maps into one portal, filters, info panels, custom buttons with links and more.
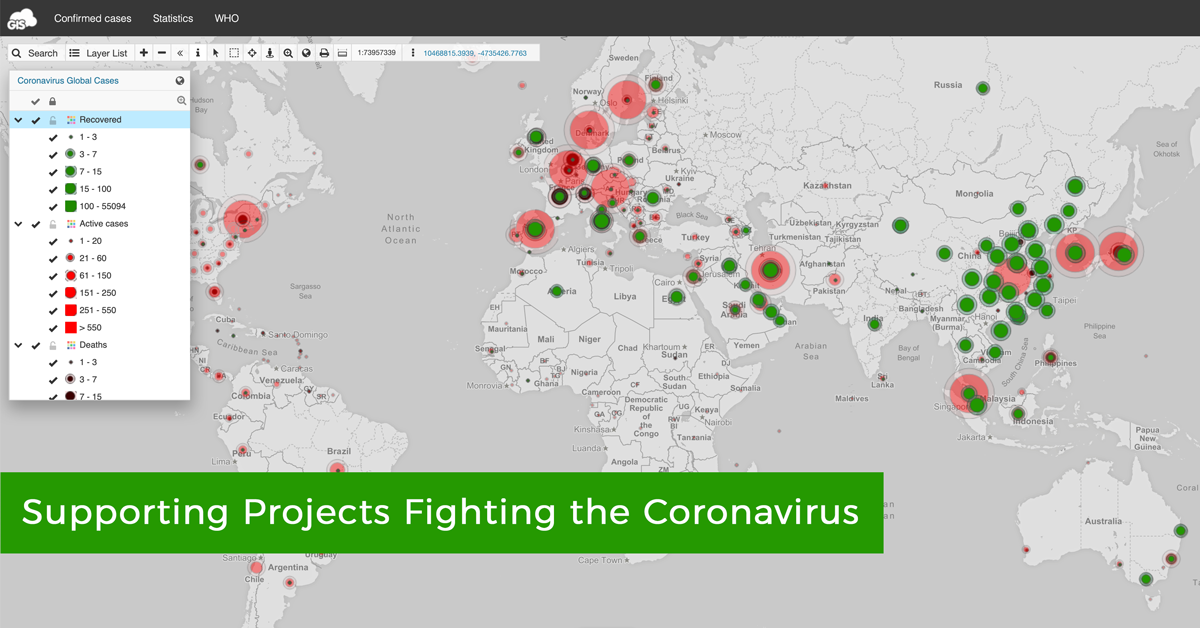
To illustrate what this project can look like, we created a public Corona Map Portal representing the number of people with confirmed Coronavirus, the number of recovered people and the number of deaths, across the globe.

Open and browse the Map Portal in a separate tab: https://corona.giscloud.com/
The map was created in QGIS desktop software to quickly classify data based on quantity, and published online through the GIS Cloud Publisher plugin. Once the map was online, we created a Map Portal because we wanted to include additional information, like links to the WHO and statistics from the Worldometer – Coronavirus Update website (embedded directly into the panel on the map). The data source we used is from The Center for Systems Science and Engineering at Johns Hopkins University.