
GIS Cloud lets us offer our clients a new and exciting visualization tool to better understand the data they report.
Technologies Management Inc.
Technologies Management, Inc. (TMI), a leading provider of Form 477 support services for telecommunication US clients nationwide, offers a service that displays the 477 results – text files with information by census tract block code, in an online map format.
This case study will showcase how cloud-based GIS can be used to visualize textual data (excel sheets) in a map format to better understand spatial data, and improve decision making in the telecommunications industry through data visualization, sharing and publishing.
Telecommunications consulting company – helping broadband and voice service providers to report data on served areas
TMI is a consulting firm established in 1986. They provide expert consulting services to clients in the telecommunications and regulated utility industries, offering extensive regulatory analysis, comprehensive informational tools and publications, effective compliance strategies and business advice.
In the last several years, there has been an increased need for broadband and voice service providers to report data to state and federal agencies based on served geographic areas.
One of the most complex reports is the Form 477 filed semi-annually with the United States Federal Communications Commission (“FCC”). Form 477 requires providers to report customer counts and deployment data by US Census Tract and Block.
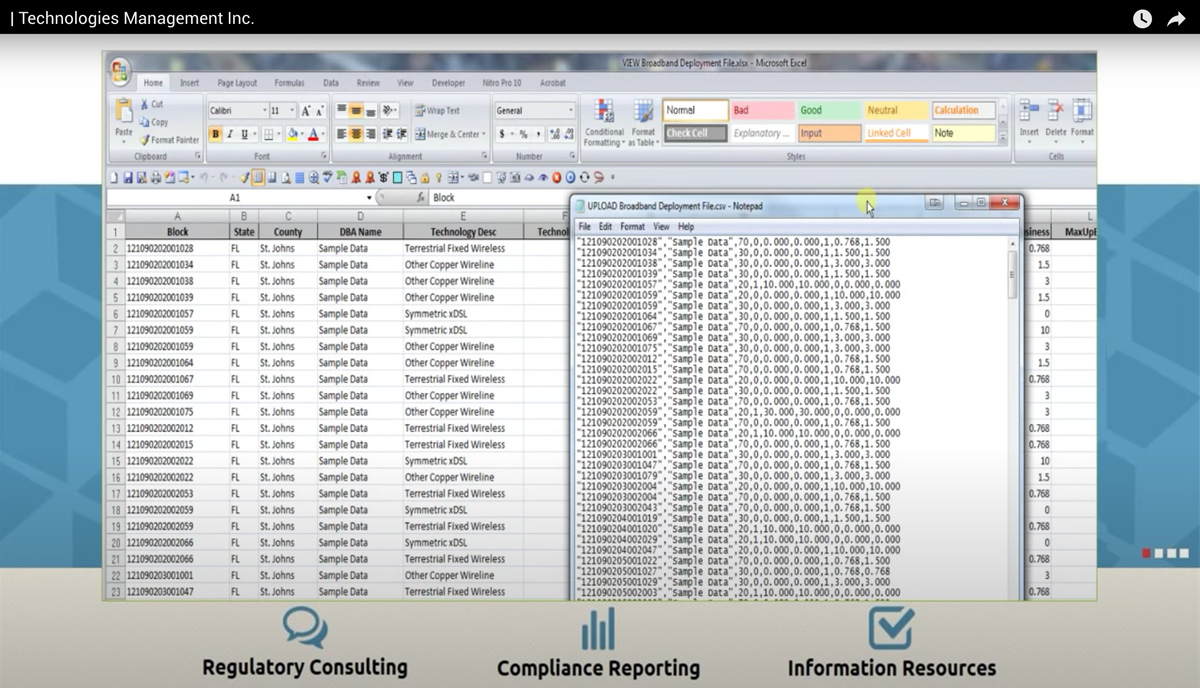
Being either a form or a report, Form 477 is actually a set of text files that contain voice and broadband counts or other information by census tract block code. Those are hard to read and unusable for understanding provider service and deployment footprint, and below the county level, hard for a provider to imagine what tracts and blocks are served, or included in their reports.
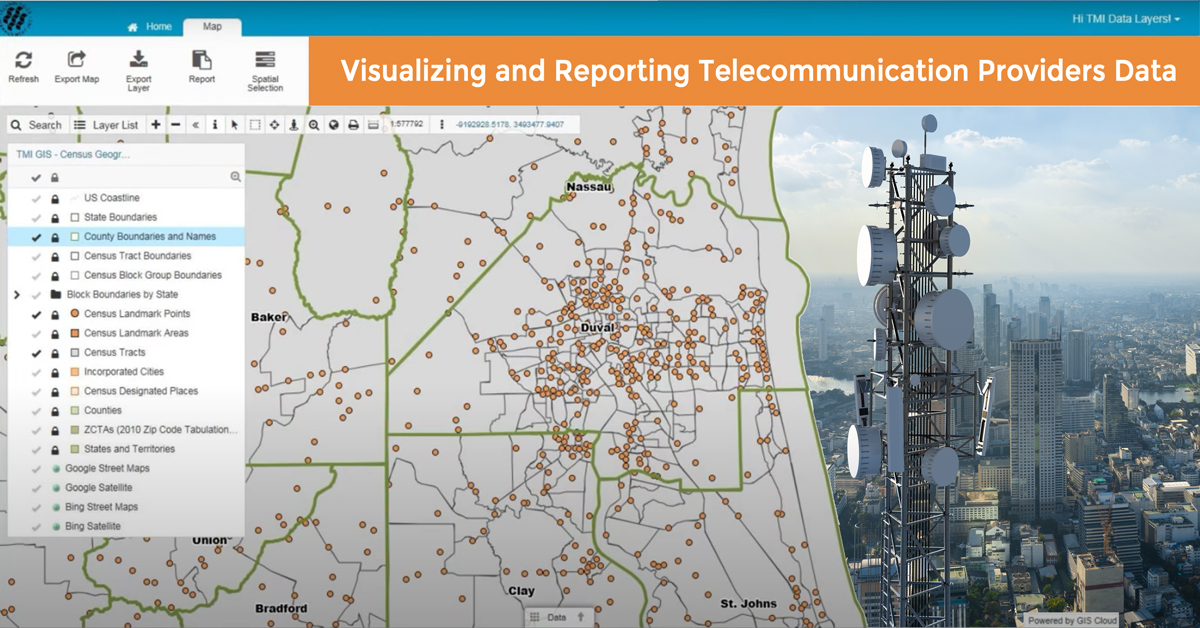
TMI offers a cloud-based service – TMI GIS online – that displays these results in an online map format:
- subscription data by census tract
- deployment data by census block
- actual locations point and data for each customer
Data can be accessed by any desktop or mobile device, no special software, hardware or GIS experience needed.
Why was this report so complex for the service providers?
Technologies Management describes the difficulties that occurred in reporting as a consequence of the fact that US Census blocks can be very small:
In many cases, they are literally that, a city block. It makes printing block-level maps impractical for clients who offer services in large areas or on a nationwide basis. It might take hundreds of maps to see a service area in the appropriate detail.
TMI wanted to offer a service that would help their clients with a reporting process that was very time-consuming and not easy to comprehend:
In the past, clients have had to review report outputs as large Excel or comma-delimited text files. The review process is cumbersome. And frankly, it is difficult to understand service areas from a list of counties, tracts and blocks.
The limitations of their desktop GIS setup
TMI considered sending spatial data such as tracts and blocks with telecommunication services boundaries in shapefiles to each client for review, as a possibility to make the reporting process easier and more efficient for them. But, this option required clients to already have GIS software and the knowledge to use it. And that was often not the case.
The primary challenge was to find a solution which wouldn’t require their clients to have an established expensive desktop GIS installation and staff trained to use it. At the same time, it was important to find a software which could handle a large amount of data and display it at fast loading speed so that their clients could have an efficient workflow with this data visualization solution.
Technologies Management Inc. wanted to find a GIS solution that would enable them to host a large amount of census data and share it easily with their clients on a web map.
The new cloud-based GIS solution for simple data overview
TMI considered many hosting alternatives for their new GIS services.
Our decision to host through GIS Cloud was due to the ease of use of the service, both for our clients and us.
The best solution was an online option that allowed TMI to post maps for review by individual clients and allowed them to access maps on any device without special software or expertise: “We felt the GIS Cloud platform best suited our plans and made this option possible.” Building maps populated with census data with many layers was easily achievable through GIS Cloud Map Editor.

TMI is now using private maps hosted on GIS Cloud as a way for clients to visualize the tracts and blocks they serve and are reporting. In addition, TMI clients can subscribe to one or more standard maps showing US Census Geography, local phone company boundaries, and other telecommunication related data. In some cases, they would make parts of these standard maps available to the general public via GIS Cloud Map Portal as well.
By converting this data into online maps, our clients can review report results much faster and have a better method for confirming that the geography described in the report is accurate.
This video shows an overview on how Technologies Management Inc. use GIS Cloud hosted maps in the Form 477 season:
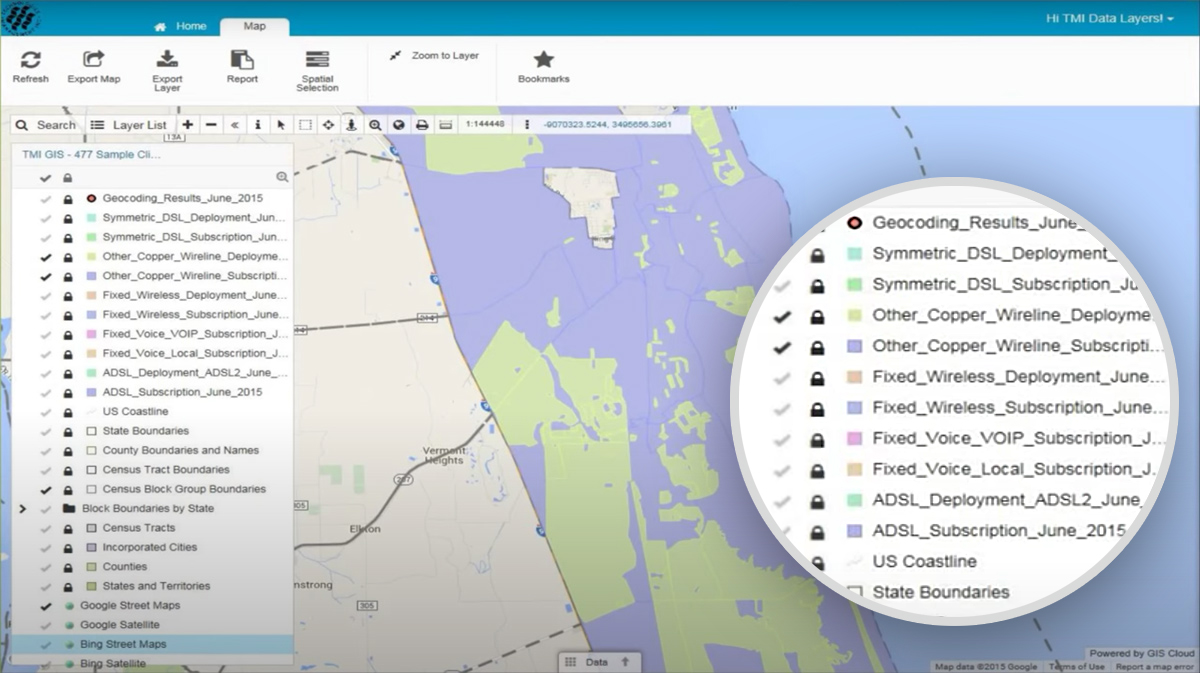
Subscription data is superimposed over shared layers, such as state or county boundaries or census tracts and blocks. It can also be viewed in conjunction with Street and Satellite maps.
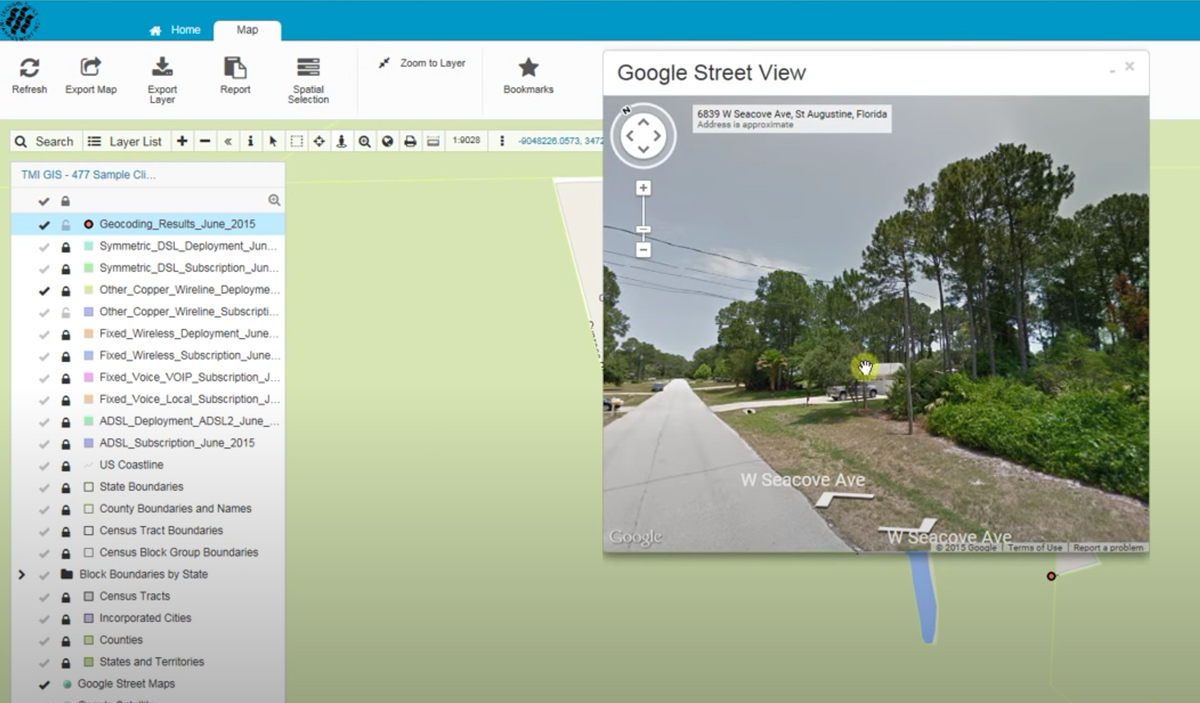
Additionally, you can look at the deployment data, view subscriber counts for a specific tract, all tracts or selected tracts, overlay tracts on the Bing Street or Satellite map with transparency, and view information on other census tracts in the area. It is also possible to look at the actual subscriber location data that underlies the 477.
TMI GIS online gives clients a new way to understand their Form 477 data. For long term clients, TMI can host current, as well as historical layers, which will let you see changes to your service territories over time.
Telecommunications Solution Key Features
Jennifer Durst-Jarell from Technologies Management Inc. summarized key features for recommending GIS Cloud:
-
- 1. App Customization, User Accounts and Data Management
The ability for TMI to create and manage private user accounts was essential. It allows us to manage maps and data for multiple clients through one interface.
GIS Cloud also makes it possible to customize the user interface for our clients through separate apps and portal domains. GIS Cloud’s system allows us to build custom maps made from proprietary client data as well as shared layers, thus eliminating the need to duplicate the same public layers for each client.
-
- 2. High Display Speed
Maps viewed in GIS Cloud are rendered quickly. Many of TMI’s maps include layers with over 11 million US Census Blocks. Usually, this number of vectors (features) would slow down the display of any map considerably. GIS Cloud handles this amount of data just fine.
-
- 3. Ability to Handle Large Datasets
Many of our map layers have over 500,000 vectors/features, the largest being over 11,000,000. The ability to upload, store and display huge datasets was key to our selection of GIS Cloud as a hosting company.

To conclude, Jennifer Durst-Jarell highlights the benefits of using GIS Cloud for TMI in their area of expertise, telecommunications industry:
TMI has been a leader in processing FCC Form 477 data. GIS Cloud lets us offer our clients a new and exciting visualization tool tobetter understand the data they report. In addition, it provides clients of our other GIS services a new method for viewing and sharing data both with TMI and other departments within their companies.
Want to know more about GIS Cloud solutions for the telecommunications and utility industry? Contact us.