
Geothermal energy is getting traction as a renewable energy source and an alternative to solar and wind farms. To better understand the geothermal potential of a country and to raise awareness, it’s best to present the geothermal resources data with interactive maps. That’s why Lea Petohleb, a graduate geologist from the University of Zagreb, created a GIS Portal that shows all Geothermal Resources of Croatia and a lot more.
Table of contents:
• Geothermal Gradient in Croatia
• Creating the Map Portal Interface
About Geothermal Energy
Geothermal energy is defined as energy stored in the form of heat in the Earth’s surface. It is a renewable source of energy that we can extract from the Earth’s crust and use for various purposes such as the production of electricity, balneology, agriculture, tourism, industry, space heating, etc.
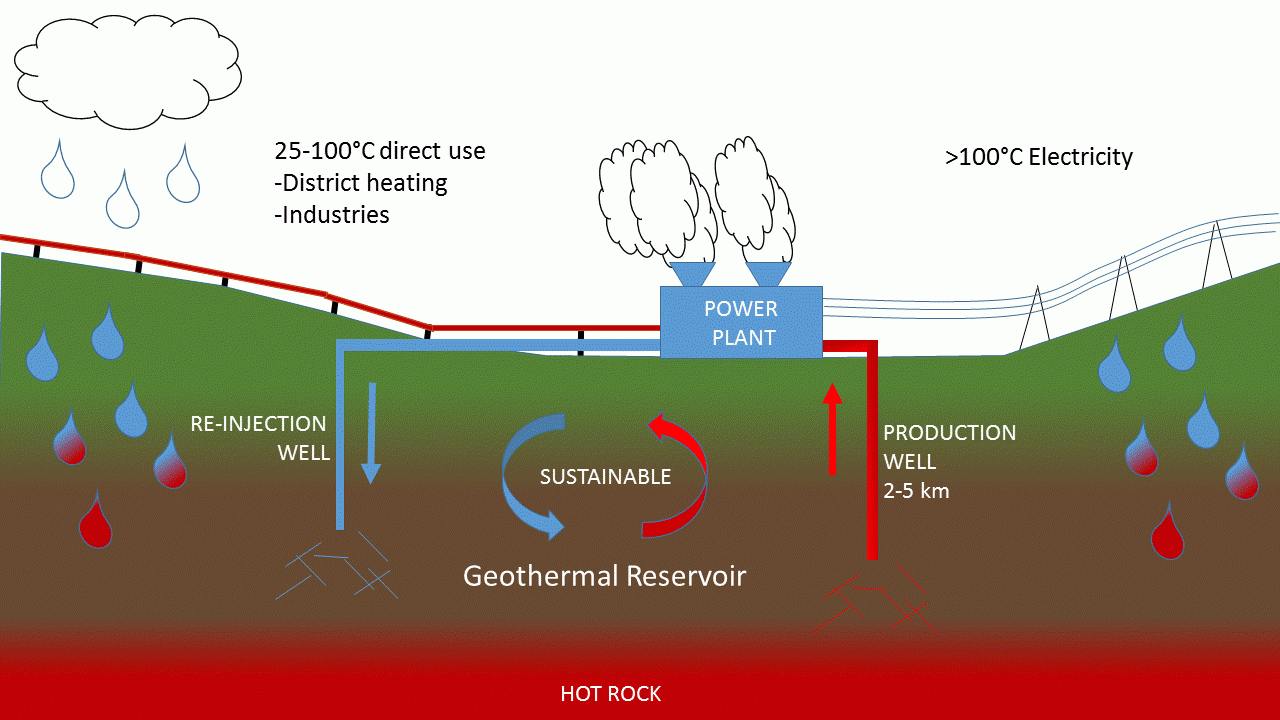
Image source and copyright: https://arcticgreencorp.com/
Geothermal Gradient in Croatia
The temperature of the Earth’s interior increases with depth. Heat is continuously flowing from a source in the Earth’s interior toward the surface. This rise in temperature per unit depth is called the geothermal gradient, and it’s one of the first indicators of a potential reservoir. The mean value of the geothermal gradient for Europe is 0.03°C/m.
The values of the geothermal gradient and the heat flow for Croatia can be divided into two distinct regions: Dinarides with Adriatic coastline and Pannonian Basin. For the region of the Dinarides with Adriatic coastline, the values of the geothermal gradient range from 0.01 to 0.025 °C/m with a mean value of 0.018 °C/m. The heat flow in this region was determined at 0.029 W/m2. In the Pannonian Basin, the geothermal gradient is in the range of 0.04 to 0.07 °C/m, with a mean heat flow of 0.076 W/m2.
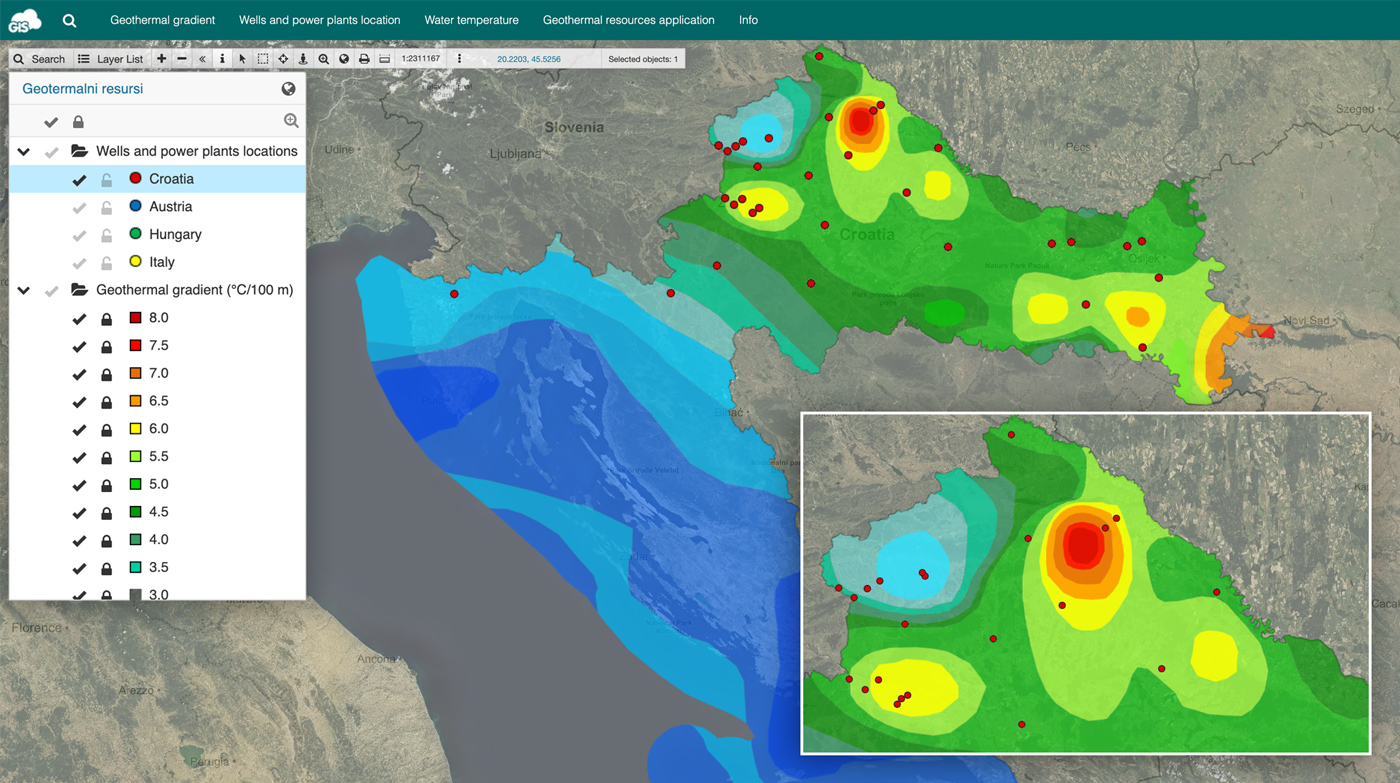
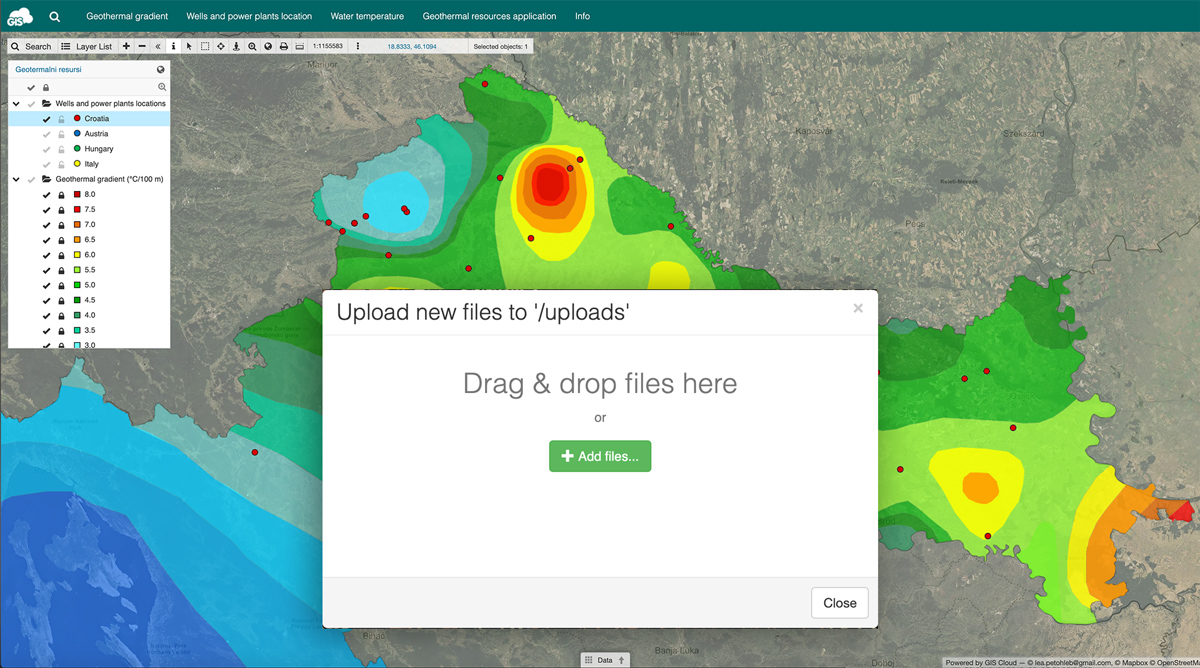
The Geothermal gradient map shows the values of the geothermal gradient in Croatia. The gradient values for the two distinct regions are visible from the colors on the map. This map created by linear interpolation is based on the data from the article ”Temperature and heat flow in the ground of Croatia” written by the Croatian Geological Society.
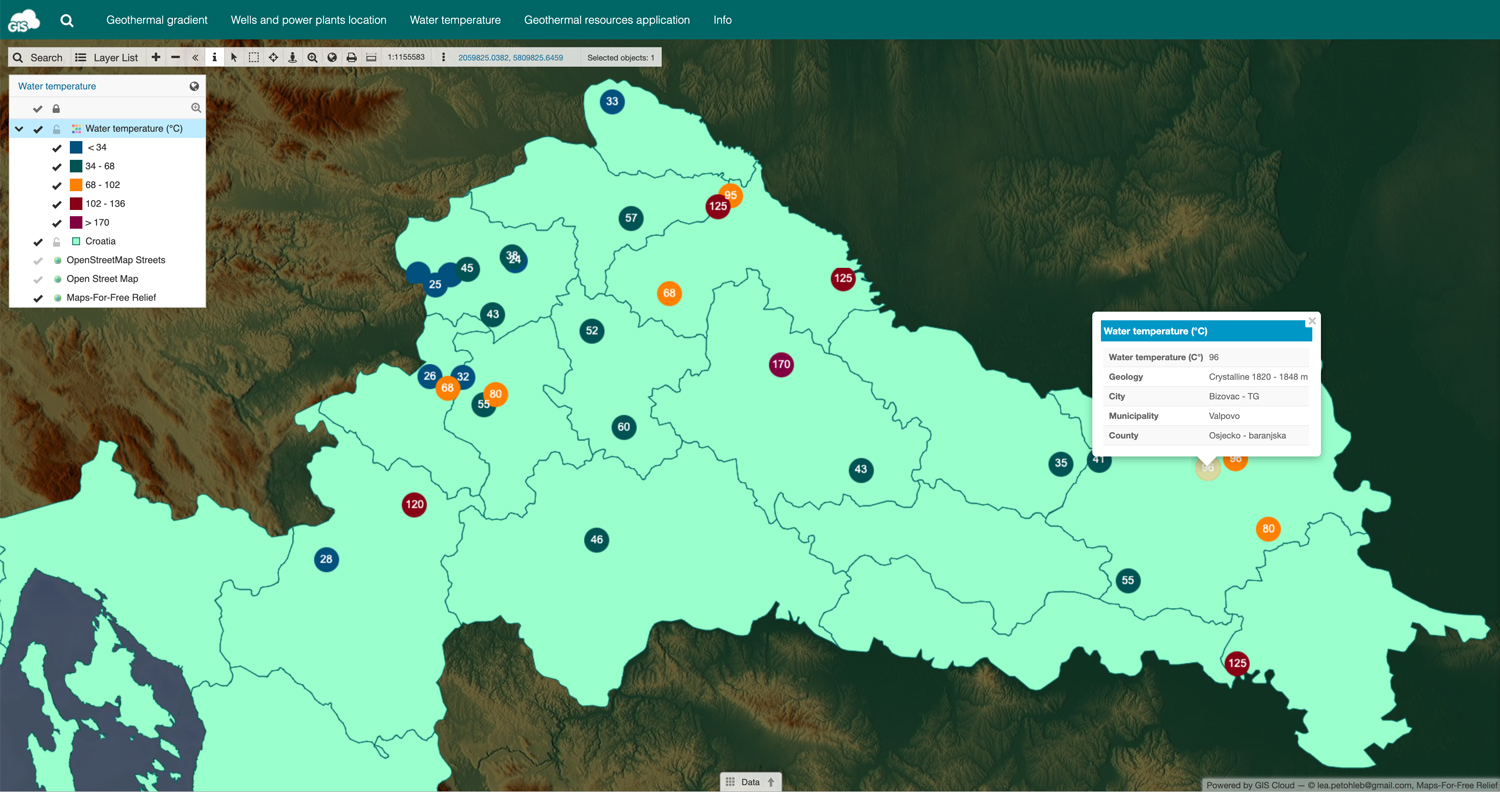
The groundwater temperature data was also plotted on the map below. It shows the well locations with groundwater temperature data plotted on the icon, for a better overview.
Geothermal Resources
Geothermal resources are geothermal waters contained in non-powered underground reservoirs as well as in underground reservoirs that are fed naturally or artificially by injection.
Today, standard international terminology for the classification of geothermal resources has not yet been defined. But, there are several ways to classify geothermal resources:
- a) by the degree of exploration and “proven” of the source,
- b) by the type of geothermal reservoirs, and
- c) by the temperature of the reservoir fluid.
To present the geothermal resources of Croatia, it was decided to present the resources according to the degree of exploration, and the temperature of the reservoir fluid which is related to the typical applications of geothermal energy.
In the past, geothermal energy was used for heating, swimming, and recreation. Today, low-temperature sources below 150 °C are used for district heating, greenho use heating, in ponds and different industrial processes. Map also includes a tooltip to instantly acquire information.
 Geothermal resources – application map
The ”Geothermal resources application” map provides an overview of the typical applications of geothermal energy and the required temperature according to GEOEN’s classification – ”Methods of applying geothermal energy and required temperature.”
Creating the Map Portal
Collecting the Data
First, it was necessary to collect available information about the geothermal resources in Croatia and central Europe. The sources used are from GEOEN (Geothermal Energy Potential and Utilization – Preliminary Results and Future Activities) of the Hrvoje Pozar Energy Institute, the European Commission and the REPAM (Renewable Energy policies Advocacy and Monitoring) project.
Visualizing the Data
The collected data saved as CSV file was uploaded in the Map Editor and used to create different layers with the option Import CSV or XLS. After the data was uploaded, certain groups of information from the CSV file were used to create layers for each map. The created layers are point or polygon (Administrative areas), and one layer is a multipolygon (Geothermal gradient on Map ”Geothermal gradient”).
After the layers were created, the next step was to design the maps. The Map Editor app offered a variety of options for customizing maps by changing colors of points, lines and polygons, adjusting the basemaps, adding custom icons, etc.
Creating the Map Portal Interface
When the maps were completed in Map Editor, it was time to create a Map Portal. The App Builder was used to create the user interface and add several features and options. This setup enables you to manage permissions for users and customize the maps. You can also specify who can view, edit, or export data from the Map Portal. Along with that, you can pick a custom domain name, choose your custom logo, and change the ribbon color.
The main toolbar can also be customized; there are many options that you can include: search input, layer list, zoom in, zoom out, show/hide toolbar, info, select, area selection, zoom to current position, etc.
If you want to learn more, take a look at this actionable guide on how to Turn Your Maps into Apps.
The Results
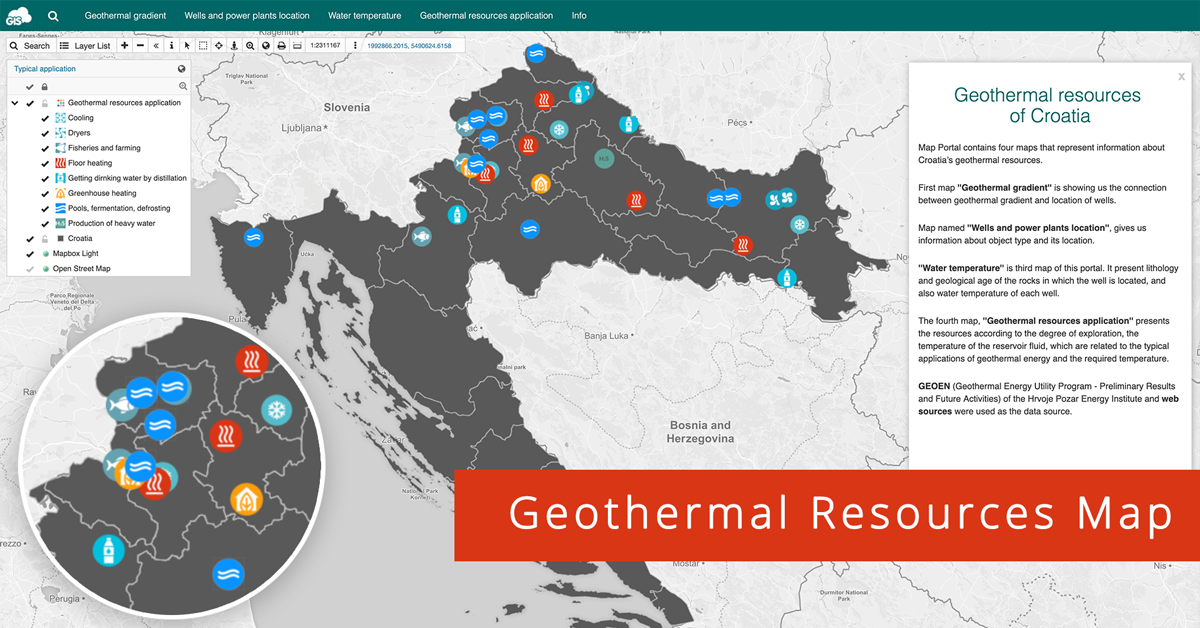
The final version of the Map Portal contains four maps that represent information about Croatia’s geothermal resources.
View the geothermal maps here >>>
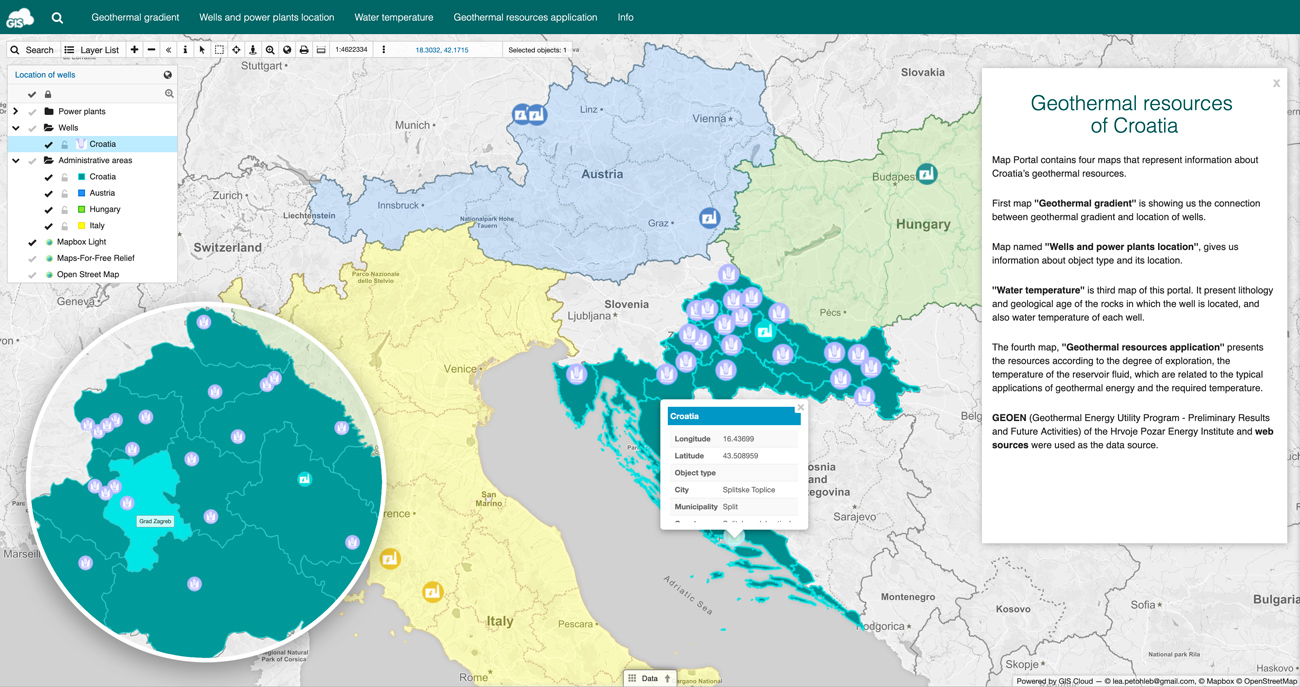
The first map, “Geothermal gradient,” shows the connection between the geothermal gradient and well locations.
“Wells and power plants location” map gives us information about the object type and its location. The map also shows the locations of power plants in Central Europe and wells locations in Croatia.
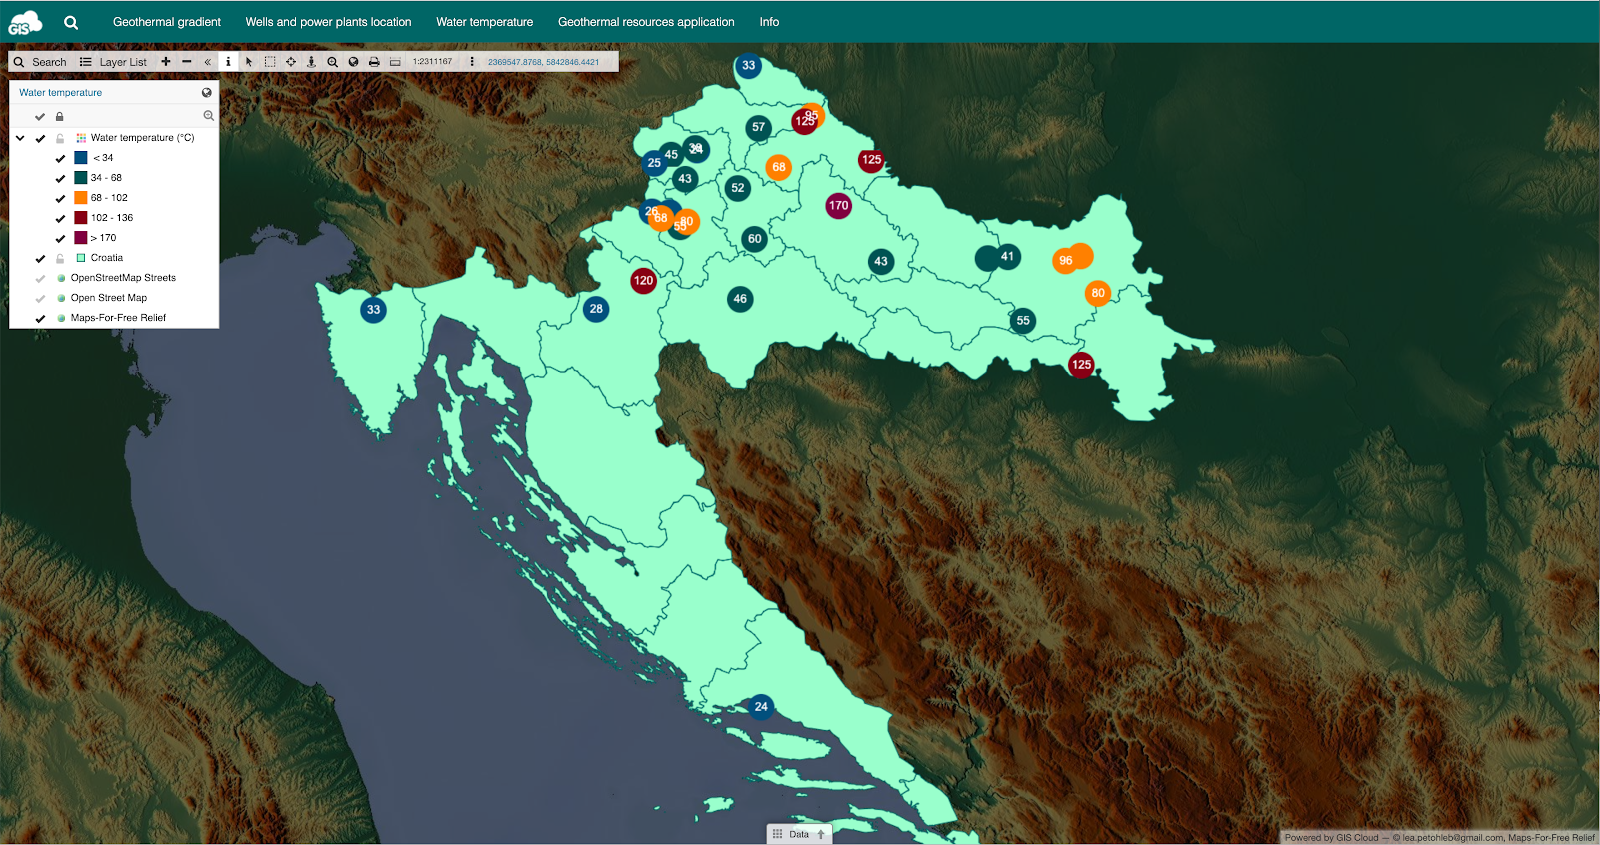
“Water temperature” map presents the lithology and geological age of the rocks in which the well is located, and also the water temperature of each well.
The fourth map, “Geothermal resources application” shows the resources according to the degree of exploration, the temperature of the reservoir fluid, which is related to the typical applications of geothermal energy and the required temperature.
Interested in creating your own Map Portal? Contact us and we’ll get you going in no time.