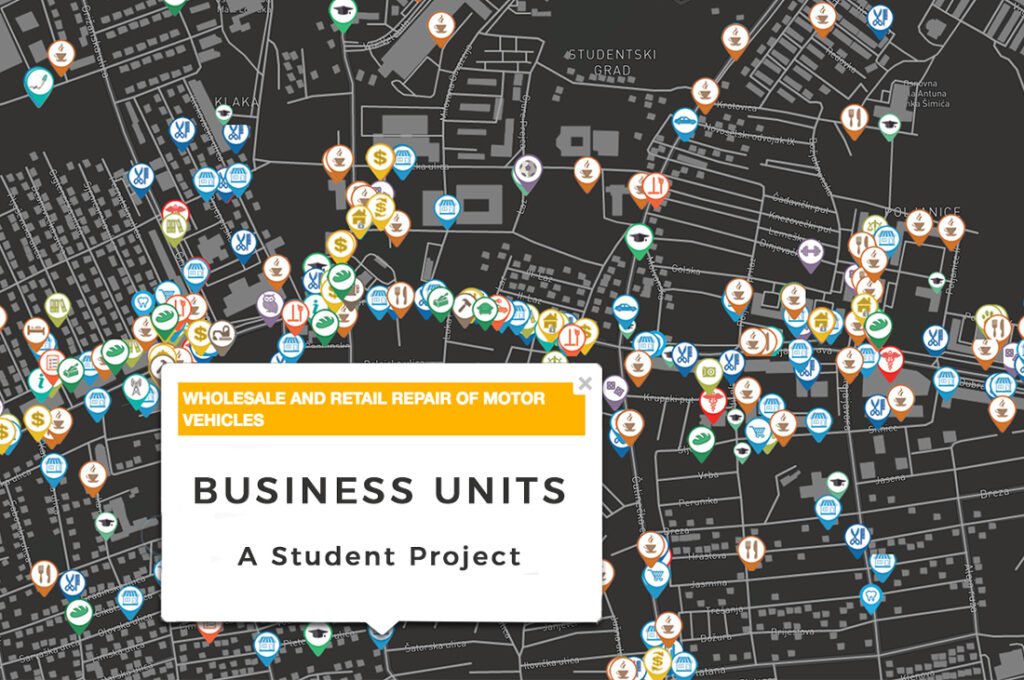
This is a case study about mapping business units in the city district of Dubrava in the City of Zagreb. The project was made by a Geography student, Stipica Šarčević, who also wrote this blog report. He explained the process of data collection, visualization, and publishing, done by using GIS Cloud apps.

Over the last three decades, spatial planning became one of the most important areas of municipal government. A lot of new models, such as cellular automata or land use analysis with GIS systems, are used in modern urban and spatial planning. When we talk about neighborhood-level spatial planning, one of the most important factors are local business subjects, often the main drivers of development and economic activity in the city district. City District Dubrava is a large district in the east part of Zagreb, administratively made up of two city districts, Gornja Dubrava and Donja Dubrava. According to the census from 2011, Gornja and Donja Dubrava together have around 100.000 inhabitants.
Because of the large-scale rural exodus in the mid-1960s, Gornja Dubrava was developed according to the spatial development plan. But, Donja Dubrava was never developed according to any plan, and today there are a lot of problems in public transportation, service delivery, and also the local businesses. Most business units opened their doors without knowing if they were even needed in the district.
The main idea behind this project was to enable access to business units for all inhabitants of Dubrava and to provide access to this information for all interested investors and local government officials. Two things we wanted to show were – How many business units are there in Dubrava? How are those units placed in space and what is their structure?
The Challenges of Residential Areas Mapping
As Dubrava was growing, new business units opened every day. After some of them had closed, they were replaced with new ones. The main challenge was to find out how many business units there are currently in Dubrava. The basic way of collecting data would mean using paper reports and manually adding points to a map in the office. This process would take a lot more time, so the challenge was to find a more efficient way of collecting data. With GIS desktop apps it is harder to get correct GPS coordinate. Most of these units can’t be found online, and most Dubrava inhabitants don’t know they even exist.
Another challenge was to show in which neighborhoods business units are more present. The goal was to see which parts of Dubrava are used as residential space and which are used as commercial space. Here was important to have a simple visualization tool that could answer that question. With a simple visualization, it would be easier to resolve different types of land use. Resolving these challenges could help future urban planning in Dubrava. It will be easier for local governments to resolve some problems with infrastructure and traffic, which are problems important to every potential future investor.
The third challenge was to make an online database of all free and empty business units. The criteria for choosing units for displaying on a map was that they could be rented or purchased. The idea is to make it easier to find a business unit in the area where you want to open your firm. The old way of doing this would mean creating an online database without spatial reference, such as an excel table. That is why it was important to find an app that would enable spatial visualization and be easily shareable with the public. Also, future investors should be able to see what the advantages and disadvantages of a particular location are.
Collecting Data and Creating a Map Portal
As has been stated, the idea was to show every business unit in Dubrava and to create an online database that shows empty business units on an interactive map. After mapping every street, the final number was 1145 business units. GIS Cloud applications supported the whole workflow, which consisted of data collection, visualization, and publishing.
GIS Cloud is a cloud-based platform that enables the users to collect data in real-time with Mobile Data Collection. With Mobile Data Collection data is instantly visible in a layer in GIS Cloud Map Editor. It is way easier than relying solely on GIS desktop software and doing collection using paper reports. For example, before using Mobile Data Collection, collecting that amount of data would probably take weeks, even months. With Mobile Data Collection, the work was done in two weeks, leaving more time for analysis.
The map of Dubrava business units was made by using GIS Cloud Map Editor.
Business units were classified in fourteen groups according to Croatian National Classification of Businesses Activities.
After the map was finished, GIS Clouds mapping experts took upon themselves to make the best out of data visualization possibilities in Map Editor by creating custom icons and a stylish background vector map.
Visit the portal that has a detailed layer list here.
Map Editor was used for doing basic analysis after collecting all the data. One analysis that was used for the project is Heat Map analysis. Heat Map analysis is a fast way to see in which part of the district business units are more present. It is a good tool to see in which part what type of businesses are missing or where there are too many of the same type, providing useful information for all future investors.
The final phase was data publishing. Map Portal was used to make all data accessible to all interested users. Local district government and potential investors can get access to every business unit in one place. Also, it is easy for local people to find something they are looking for. For example, through Map Portal, they can find the nearest beauty salon, grocery store, etc. Also, you can customize your Map Portal by changing the logo, viewable layers, and other features.
Map data can also be edited on any device such as mobile phones, tablets or laptops. If someone were to open a new business, they would be able to put its location online in a couple of minutes. That data would contain precise GPS coordinates, street address, type of business unit and its working time.
Business in Dubrava is changing from day to day and having an interactive map enables an easy update of new business units. Having this kind of online database is also important for future investors. Using the interactive map, any business investor can see where the best places for opening a new business unit are. In the future, this map could be used as a database for more advanced analysis. While the City of Zagreb is still growing, this map can be used as a base for similar projects in other districts of Zagreb.
Interested in creating your project in GIS Cloud? Sign up here.


