
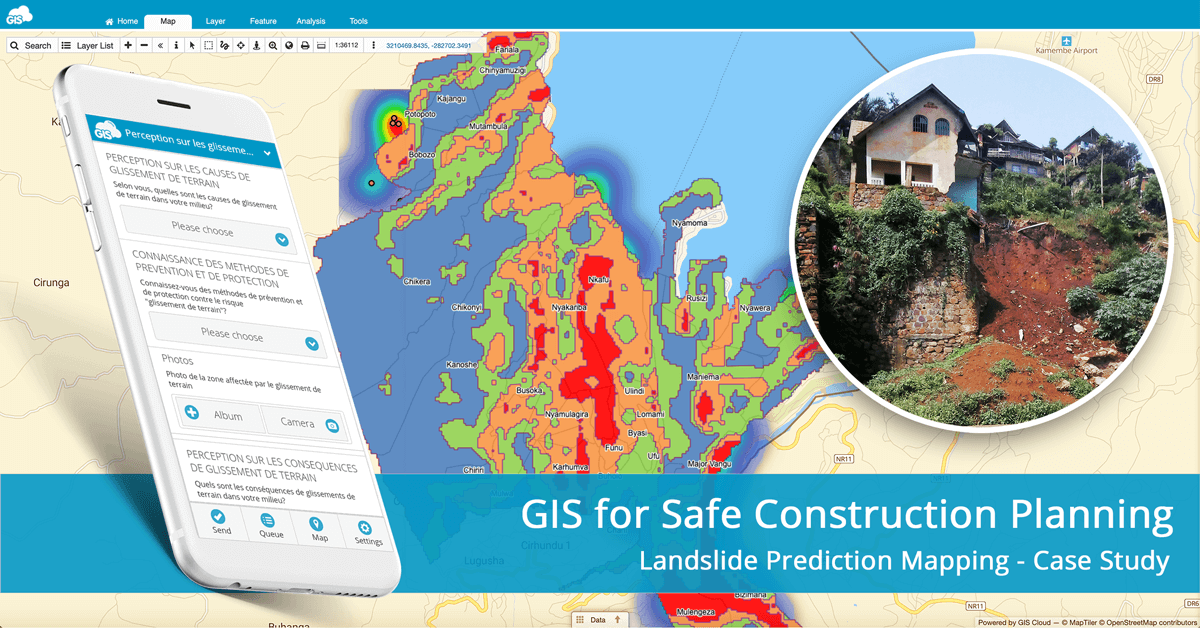
Landslides in the Kivu region (DRC, Africa) caused significant socio-economic destruction and have highly impacted the population. BEGE-RDC, a nonprofit organization, integrated its desktop and online workflow and created a heatmap with GIS Cloud apps that would emphasize the hotspots of the landslides and help predict development risks of this region.
How can mapping landslides with GIS Cloud help reduce people’s vulnerability living in habitats susceptible to natural disasters? Let’s find out!
Case study outline:
- Choosing the right solution to achieve projects goals
- The urban consequences of landslide risks
- Main goals and project objectives
- Mapping landslide susceptibility
- Predicting landslides to facilitate risk management
- Mobile Data Collection is Key
- Replacing paper with technology
- Integrating desktop and online workflow to create landslide heatmap
- The benefits of cloud solutions in the GIS workflow
Choosing the right solution to achieve projects goals
The Democratic Republic of Congo (DRC) in general, and the Kivu region, are facing severe landslide risks which are causing significant economic, infrastructural and development issues at the local level. Between 2010 and 2015, landslides caused the death of 134 people, destruction of 700 homes and 4 schools in the province of South Kivu.
Our GIS Day Contest winners, BEGE-RDC is a nonprofit, nongovernmental organization headquartered in the city of Bukavu where the project originated. They are an organization member of the UN Sustainable Development Solution Network.
BEGE-RDC recognized the benefits of GIS in order to map landslides and create a heatmap with the help of GIS Cloud apps. They aim to contribute to the rational management of natural resources, the protection of the environment and the management of natural risks (forecasting and prevention) in the DRC. Main activities concern research, expertise, advice and training in the field related to geology and the environment.
Their contribution made the South Kivu region a much safer setting to live in and plan future economic and infrastructure development.
There are three key GIS Cloud features BEGE-RDC highlights as the most beneficial for their workflow:
- Form editing (option to edit and sync Mobile Data Collection questionnaires)
- Sharing data
- Real-time heatmap
GIS-based solutions are essential for managing problems related to natural hazards. GIS makes it possible to make a spatial analysis of the vulnerability, hazard and public perception of risks.
Jean Nacishali (BEGE-RDC)
BEGE-RDC continues to contribute to the rational management and protection of natural resources with an emphasis on forecasting and prevention of natural risks in the Democratic Republic of Congo.
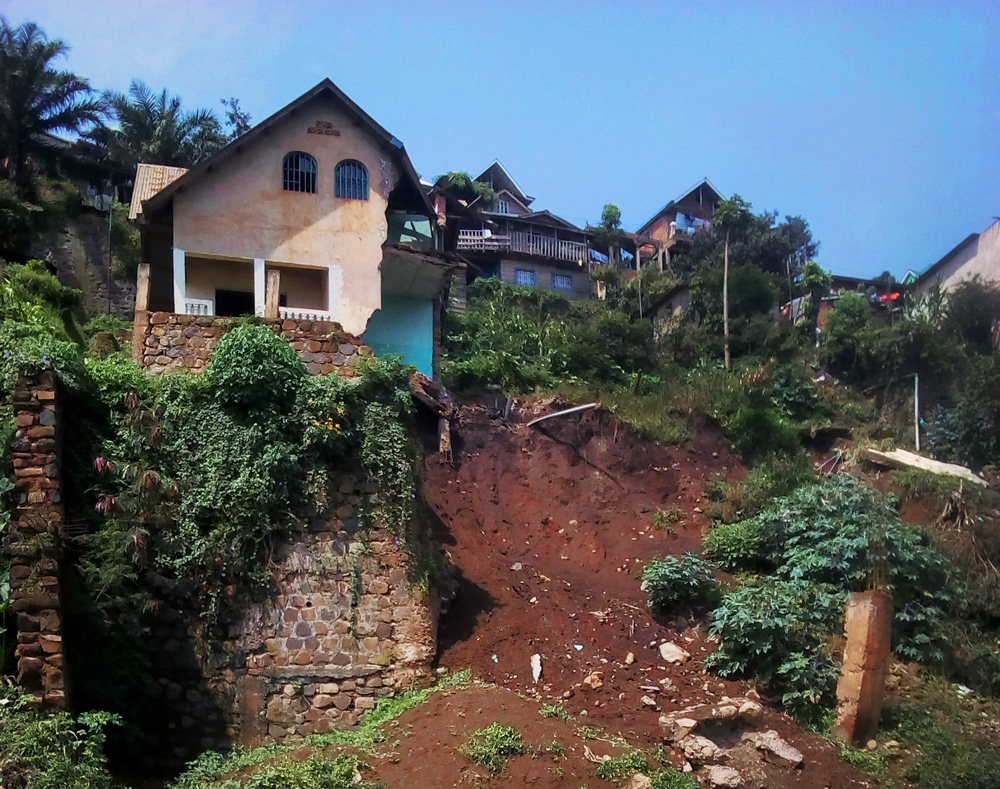
The Urban Consequences of Landslide Risks
Main goals and project objectives
Until now there wasn’t much spatial information considering landslides in this region that would inform and help South Kivu’s population on where and how to prevent the risks of landslides.
Therefore, a good understanding of the perception of the population on risks, awareness and knowledge of the risk is crucial for the development and improvement of risk management and communication strategies between local authorities and the population.
In this way, the project aims to map the susceptibility to landslides using GIS techniques and to determine the people’s perception of this risk based on interview data in the Kivu region.
The main goal was to:
- Map the susceptibility to landslides
- Create a heatmap
Creating a heatmap with GIS Clouds Map Editor was based on two independent sources of data: landslide survey data and interview data.
Mapping landslide susceptibility
The landslide survey focused on getting the information from the leaders of the administrative entities on the frequency of landslides in the last 5 years (average number of slip recorded in the district per year) and the evolution of the slide for the last 30 years.
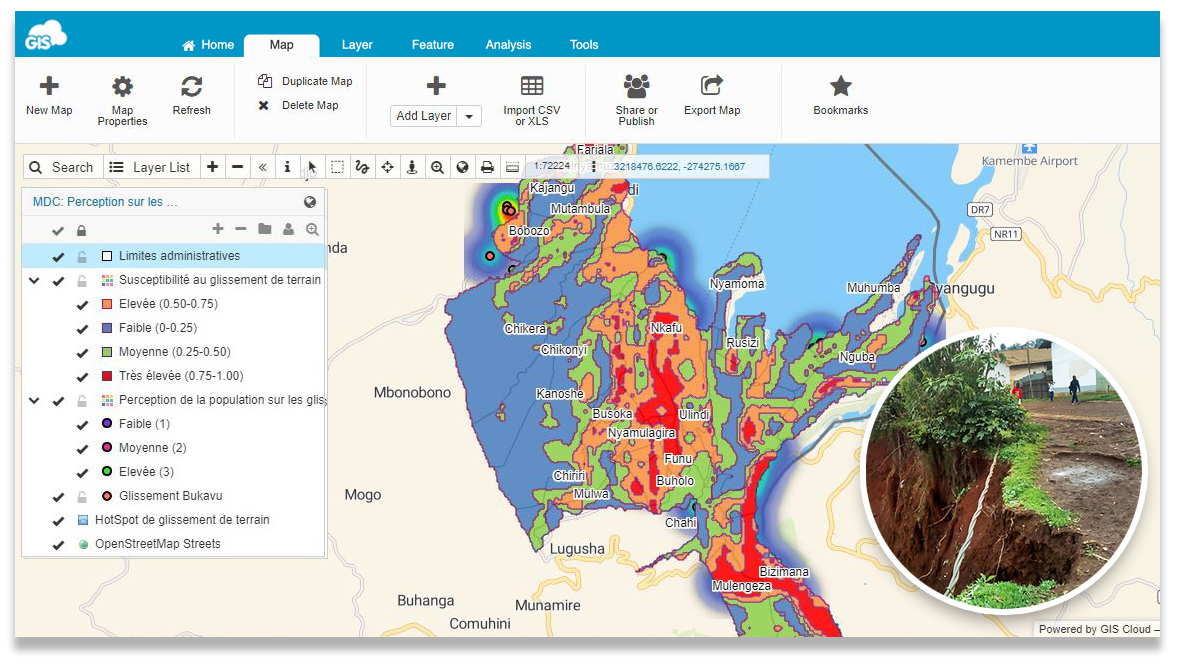
Open and explore the Susceptibility map
For landslide susceptibility mapping, BEGE-RDC performed a detailed spatial analysis of landslide frequency over the last 5 years, spatial analysis of landslide evolution over the past 30 years and spatial analysis of the occurrence of landslides.
For each of these analyses, they established a model that takes into consideration:
- topographic and geological variables
- vegetation density and cover
- distance to roads
- drainage networks
- soil type
- precipitation, etc.
BEGE-RDC performed all these activities to predict the risk probability of landslides. The main challenges they faced were the acquisition of data and financial resources needed to cover the entire region.
With the help of GIS Cloud apps and Services, BEGE-RDC collected all the relevant data amongst the South Kivu population eliminating paper surveys and reducing costs.
They managed to create a representative map that would indicate the probability of high-risk landslide areas in order to help save future lives and plan safe infrastructure, construction and economic investments.
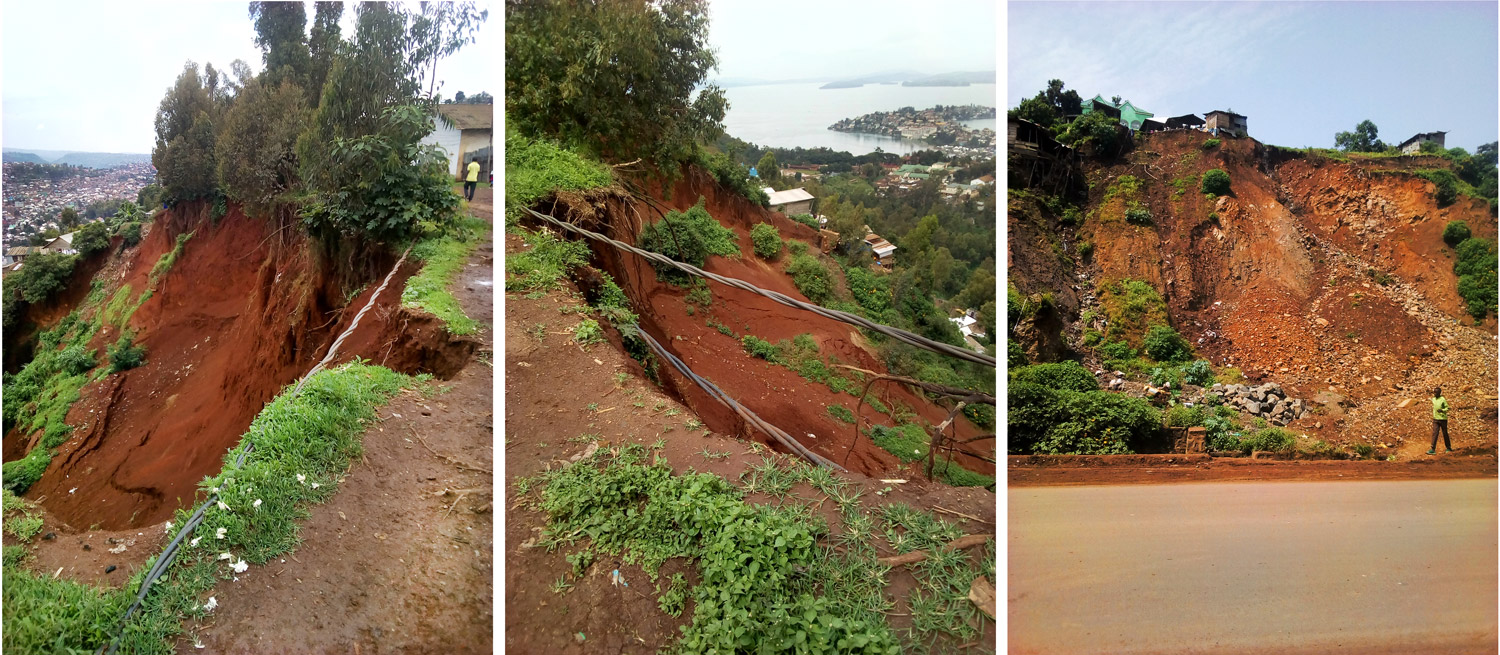
Predicting Landslides to Facilitate Risk Management
A landslide is defined as the movement of a mass of rock, debris, or earth down a slope. The effects of landslides can be hazardous for the environment including the loss of human lives.
Landslides cause:
- property damage
- water supplies pollution
- forests devastation
- road damage
- human injuries, etc.
The most crucial matters BEGE-RDC did are the preliminary studies on the mapping of different areas exposed to terrain instability regarding landslides.
Being aware and understanding the risks of landslides was critical for the development and improvement of risk management and communication strategies between local authorities and the population. As mentioned before, landslides cause a tremendous economic loss and loss of many lives in the Kivu region.
Mobile Data Collection is Key
Using GIS Cloud Mobile Data Collection (MDC) app to determine inhabited areas of Kivu region that are in a high risk of landslides, BEGE-RDC took into consideration that each individual perceives risks differently, depending on the resilience of the communities. They produced all the necessary surveys and questionnaires, helping them understand how people perceive landslides risks.
To achieve this, they have created a form (questionnaire) containing data grouped into several categories including some required such as:
- demographic data
- perception of causes
- consequences and preventive measure
- risk communication
- degree of fear
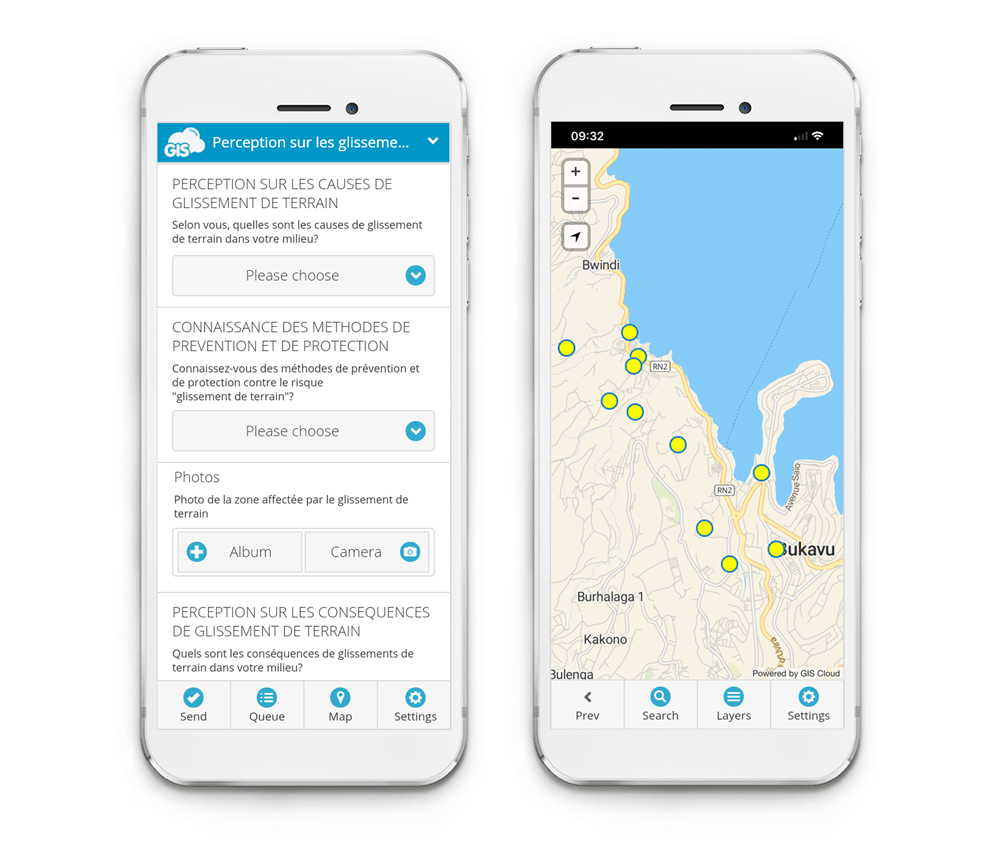
Replacing paper with technology
During the data collection activities, the GIS Cloud solution allowed them to replace paper questionnaires with the MDC app.
This made volunteer jobs much easier and accessible, further reducing the cost of data encoding. Right after volunteers collected the data, it was immediately available for processing. They did all of this using only their own smartphones!
Thanks to all of the collected MDC data, a risk perception index was established based on the survey data:
| Scale of risk perception | Aware of the cause of the landslide | Fear of landslide | Consider household at risk | Willing to move to a safer location | Index of risk |
| High-risk perception | Yes | Yes | Yes | Yes | 3 |
| Medium-risk perception | Yes | Yes/No | Yes/No | Yes/No | 2 |
| Low-risk perception | Yes | No | No | No | 1 |
The MDC application, in particular, makes it possible to replace the methods of collecting survey data by paper with the smartphone application
Jean Nacishali (BEGE-RDC)
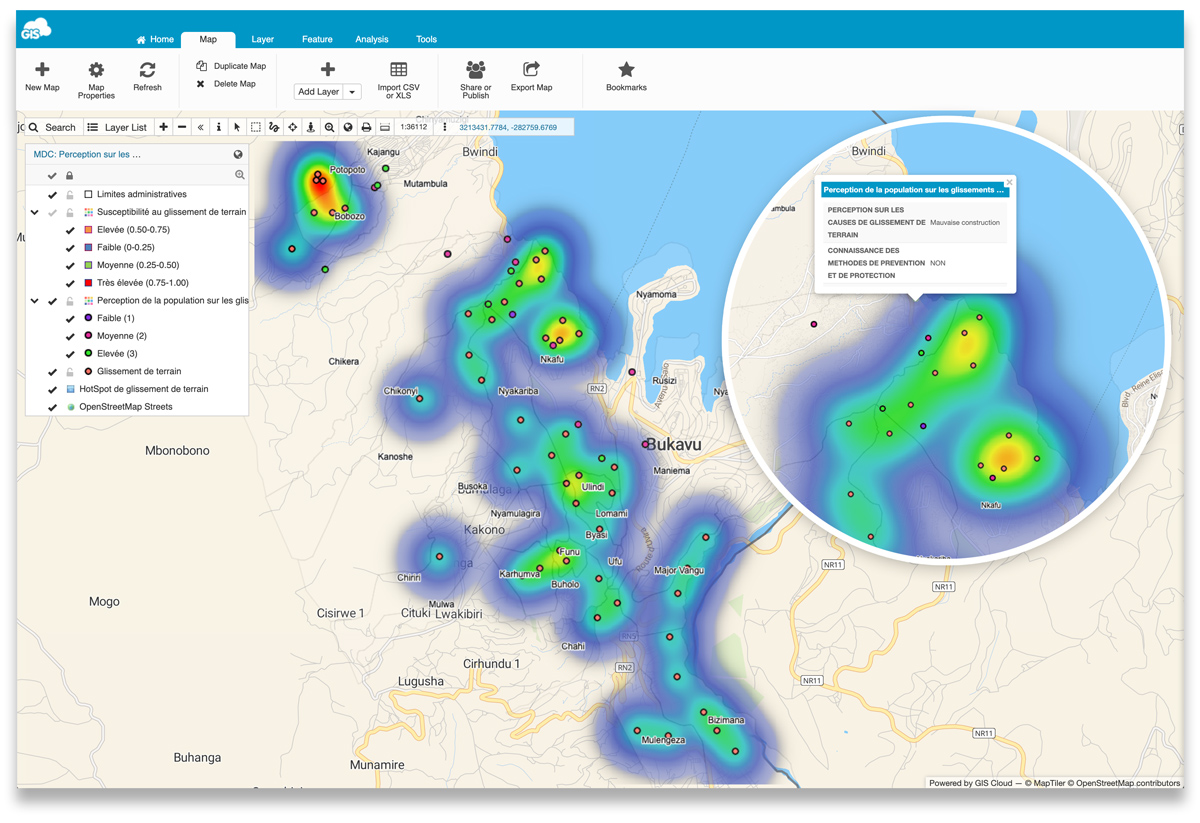
Integrating desktop and online workflow to create landslide heatmap
This project made it possible to spatially present the level of perceptions of the respondents in relations to landslides. BEGE-RDC used the R software in order to perform a model of landslide occurrence according to factors of predisposition.
Different categorical data (hydrological, topographic, human activity, etc.) that volunteers collected and prepared subsequently in QGIS as a raster image was later processed and presented spatially in GIS Cloud Map Editor.
![]()
Now you can speed up your workflow using our new plugin, Publisher for QGIS to transfer your maps from QGIS to GIS Cloud.
The centroids of the landslide polygons were used to perform a Heatmap analysis in order to show the landslide hotspots, indicating where landslides are more recurrent!
With Map Editor BEGE-RDC have been able to bridge the gap between desktop and online GIS software displaying spatial data in real-time. This way they made all the data beneficial and accessible to the public.
GIS Cloud solutions make it possible to optimize the visualization of spatialized data. These mapping tools can be used by government organizations and civil society organizations to communicate the public’s perception of the risk.
Jean Nacishali (BEGE-RDC)
The Benefits of Cloud Solutions in GIS Workflow
GIS Cloud helped BEGE-RDC to collect data and perform spatial analysis of public perception and vulnerability of landslide risks in the Kivu region. Volunteers were able to perform surveys with people in real time replacing outdated paperwork.
They increased work performance by reducing operating costs and decreasing human error using GIS Cloud apps. This way, they increased data quality that made them more efficient. Furthermore, the created exemplary heatmap in Map Editor conveys the perception of landslides risks helping future generations predict serious construction and economic problems including the loss of human lives.
Mapping of environmental risks can be used in the context of perception and prediction of natural risks such as seismic, flood or anthropogenic risks. This kind of mapping will help in sensitizing local communities and raise awareness in future socio-economic planning purposes. GIS can directly help in the structuring of economic and population measures in those critical areas.
In the future, they intend to use the achievements of this pilot project in the context of raising public awareness of landslides risk. They plan to extend the area of their project, assess the population’s perception of the risks in the different territory, produce landslide probability maps for each territory and make these maps available to the public.
GIS-based solutions are essential for managing problems related to natural hazards.
Jean Nacishali (BEGE-RDC)
Want to set up your own GIS workflow for construction planning or managing natural hazards? Contact us.