
This project was done by a geography student Branimir Bilandžić, who collected and visualized data with a goal to make a proposal on the topic how to rationalize local government structure in Croatia. As a result, map portal was created, showing a proposal for the new municipality structure. This project was done using the example of the Zadar county.
The Zadar county occupies the central area of the Adriatic Sea in the south of the Republic of Croatia. Zadar is the center of the region, a 3 000-year-old city that was the capital of Dalmatia from the 7th century to the end of the Second World War. This area has a total population of around 170 000 people and a surface of 7276km² (3643 km² of land). The county is not equally developed in all its parts. For example, the continental part is less populated that the coastline which is heavily impacted by tourism together with its many islands. County itself is made of 28 municipalities and 6 cities. The biggest settlement is Zadar with around 75 000 inhabitants and is 7 times bigger than Benkovac, the second biggest city.
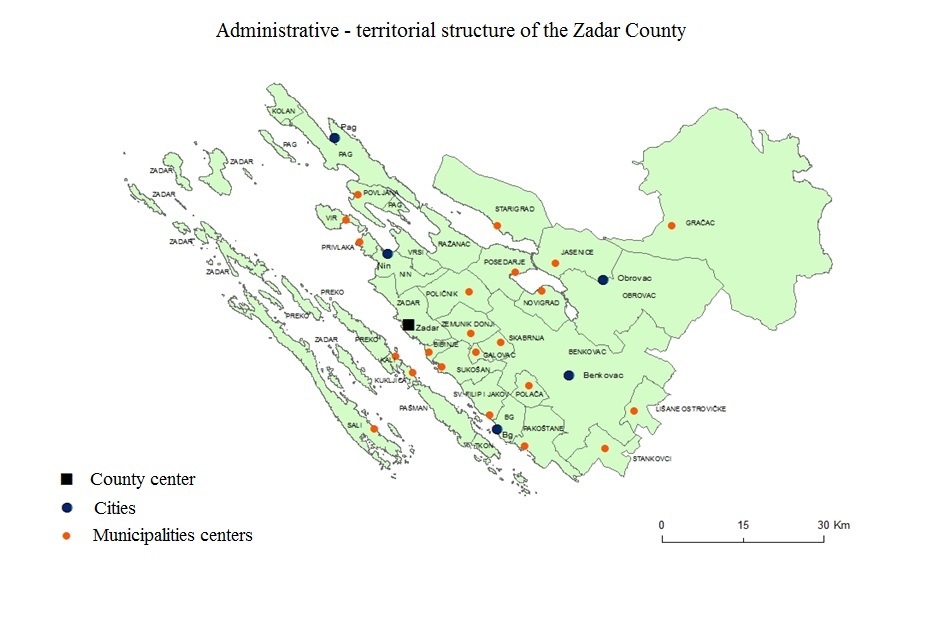
The Zadar county occupies the central area of the Adriatic Sea in the south of the Republic of Croatia. Zadar is the center of the region, a 3 000-year-old city that was the capital of Dalmatia from the 7th century to the end of the Second World War. This area has a total population of around 170 000 people and a surface of 7276km² (3643 km² of land). The county is not equally developed in all its parts. For example, the continental part is less populated that the coastline which is heavily impacted by tourism together with its many islands. County itself is made of 28 municipalities and 6 cities. The biggest settlement is Zadar with around 75 000 inhabitants and is 7 times bigger than Benkovac, the second biggest city.
As you can see on the picture above, there are a lot of small and non-logical local government units (cities & municipalities). The main goal was to find out if there was a way to improve existing structure according to relevant indicators. For example, in the new proposal, Novalja municipality was added from the Ličko-Senjska county to Zadar county because it is located in the north of the Pag island and it is the only municipality that is outside of the Zadar county. In a construction of this project, a simple yet intuitive tool to present results of the new proposal to the public was needed. Using GIS Cloud platform for visualization proved to be a perfect tool for the job considering a short period of time. The biggest advantage of using GIS Cloud platform in this project was a user-friendly interface, while the project can be easily scaled to include various stakeholders and public. This is the main benefit in using cloud solution compared to using a desktop software.
Methods
The methodology that was used is very simple. There were three stages in the process of determining whether the units should stay as they are, join with one another or maybe split into more units. The first stage was picking out indicators which would show us the best statistical picture of the region. The method itself consists of using 7 indicators. They were: population, inter-census changes (2001.-2011.), the number of workers, the share of workers in the municipality, share of commuters (in relation to the total population), existence of the central functions (post office, patient clinic, kindergarten…) and transport network coverage. Every city/municipality was awarded points depending on how many criteria were satisfied. Total maximum number of points was 35. At the end, municipalities which have 19 or more points would retain their status.

Click on the picture to view an interactive portal in GIS Cloud
In the analysis, the results were as follows. Firstly, Gračac changed its status from a municipality to a city because the area needs a closer center as it is very underdeveloped and heavily depopulating. Secondly, Novalja municipality was created from Ličko-Senjska county. Furthermore, 13 municipalities were reorganized as they scored lower than 19 points. At the end, the total number of municipalities came down from 28 to 18 and number of cities raised from 7 to 8. The goal of the project was to find a visualization tool to point out that there exists a need to reorganize the county structure.
The third step was to visualize the results using GIS Cloud Map Editor. First, in just a few clicks shapefile was uploaded to the cloud. After that, a new map was created in the GIS Cloud Map Editor. The system allows choosing from a several different basemaps such as Bing Maps or Mapbox. Next step was to visualize data as a layer. The last thing to do was to use different visualization possibilities of the Map Editor such as colors and labels.
Next steps
The goal of this project was to demonstrate the value of GIS Cloud in the visualization of administrative boundaries according to different criteria. But this was only the first step in utilizing GIS Cloud. As this is a cloud-based platform it enables you to easily share a project with the public across devices.
In case you want to share a project with the public and engage citizens to get their feedback, a map can further be customized in a branded Map Portal. You can enrich data even more by adding features such as pictures, concrete statistics with indicators, transportation network, pdf files etc. Map Portal also allows engaging citizens by allowing their feedback directly on a map.
Secondly, the biggest benefit of having a cloud-based system is in the real-time collaboration. You can share data directly with various stakeholders including local governments, planning experts, municipality departments. They can simultaneously work on a project adding comments and making decisions, working on spatial data without having to meet in person. This saves a lot of time, reduces mistakes, reshapes working process that would take much longer with paper maps or desktop apps.
Interested in trying out GIS Cloud solutions? Sign up here.