
Hydrology databases make it possible to map, track and observe water resources. Monitoring and modelling the data is essential in creating a sustainable system for managing the public water supply. Having to find and track down needed information manually is inefficient and unreliable, especially when taking into consideration that all assessments and analyses are made with geospatial data (vectors and rasters). This article will show you how to create a hydrological map portal with a real-life example.
Marko Sinčić, a graduate hydrogeologist from the University of Zagreb, created this project to bring the hydrology data of the Karlovac Municipality to the broader audience, the civil engineers, geotechnicians, hydrogeologists, scientists and others who can make good use of the data. This comprehensive hydrology inventory was made public via a map portal powered by GIS Cloud.
Table of contents:
• Available Hydrological Information
• 1. Data Observation Stations
About the Geospatial Data
To carry out any kind of hydrological analysis, certain geospatial data is needed: environmental factors, elements at risk and triggering factors for landslide events. Most commonly used are the environmental factors, that include data like geology, soil science, hydrology, geomorphology, land use, and digital elevation models. Elements at risk include buildings, transportation networks, lifelines, essential facilities, population data, agriculture data, economic data and ecological data (elements at risk in this project are limited to a narrow town area). Triggering factors include rainfall, temperature data, evapotranspiration, ground acceleration, and earthquake data.
Since the portal is publicly available and third parties can freely download the layers, it consists only of the information already available somewhere else (due to copyright) or with the information developed from the available data. However, it’s the only place where the data is integrated, highly searchable and easily accessible for everyone. Also, anyone can export the data they need by using the GIS Cloud Export feature integrated into the map portal.
Hydrology inventory was created by digitizing a topographic map of Croatia 1:25 000, with watersheds and the drainage system as an exception, which were created with desktop GIS tools. Elements at risk and land use vector basemap were downloaded from open source databases and later imported.
Creating the Hydrology Maps
Most of the layers were made in ArcMap and transferred to Map Editor with the GIS Cloud Publisher for ArcMap, and later imported to the Map Portal. All data observation stations were added as point objects using their coordinates. Since the Map Editor has a hotspot tool for point objects, it was used for making hotspot maps for each point object from the hydrology inventory group.
Geomorphological basemaps were creating in ArcMap, but a huge variety of background basemaps can also be found in the Map Editor, and a few were selected to be a part of the map portal.
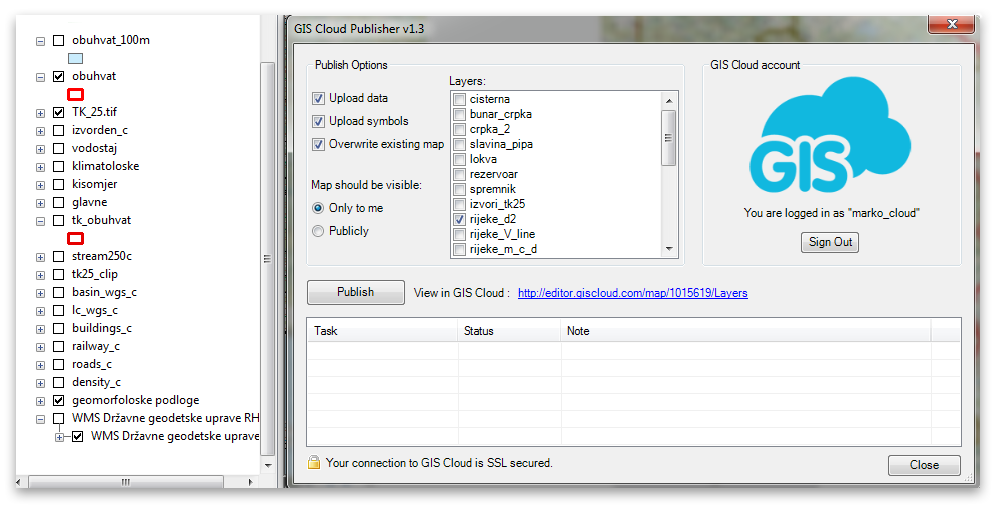
Publisher for ArcMap is a fast and reliable tool to transfer all vector data from ArcMap to the Map Editor. It instantly recognized all vector layers preserving its attribute table and successfully uploading them where needed. Since most of the layers are vectors major part of the work was done in an instant. Few raster data were imported manually to the Map Editor. Combining the two features made the transfer process as simple and efficient as possible.
Available Hydrological Information
In the next few sections, we provide a detailed description of each layer and its use. Layers are grouped by themes to make things more manageable.
Data Observation Stations
This group consists of main weather stations, climatological stations, rain gauge stations, and river level monitoring stations, all being point objects. The first two offer a variety of climatological and meteorological information available for the given location. Rain gauge distribution is important in determining the amount of liquid precipitation in certain areas. Rain is one of the most important triggering factors, gathering data from these stations is used to predict and analyze further events, as well as determining why some occurred in the past.
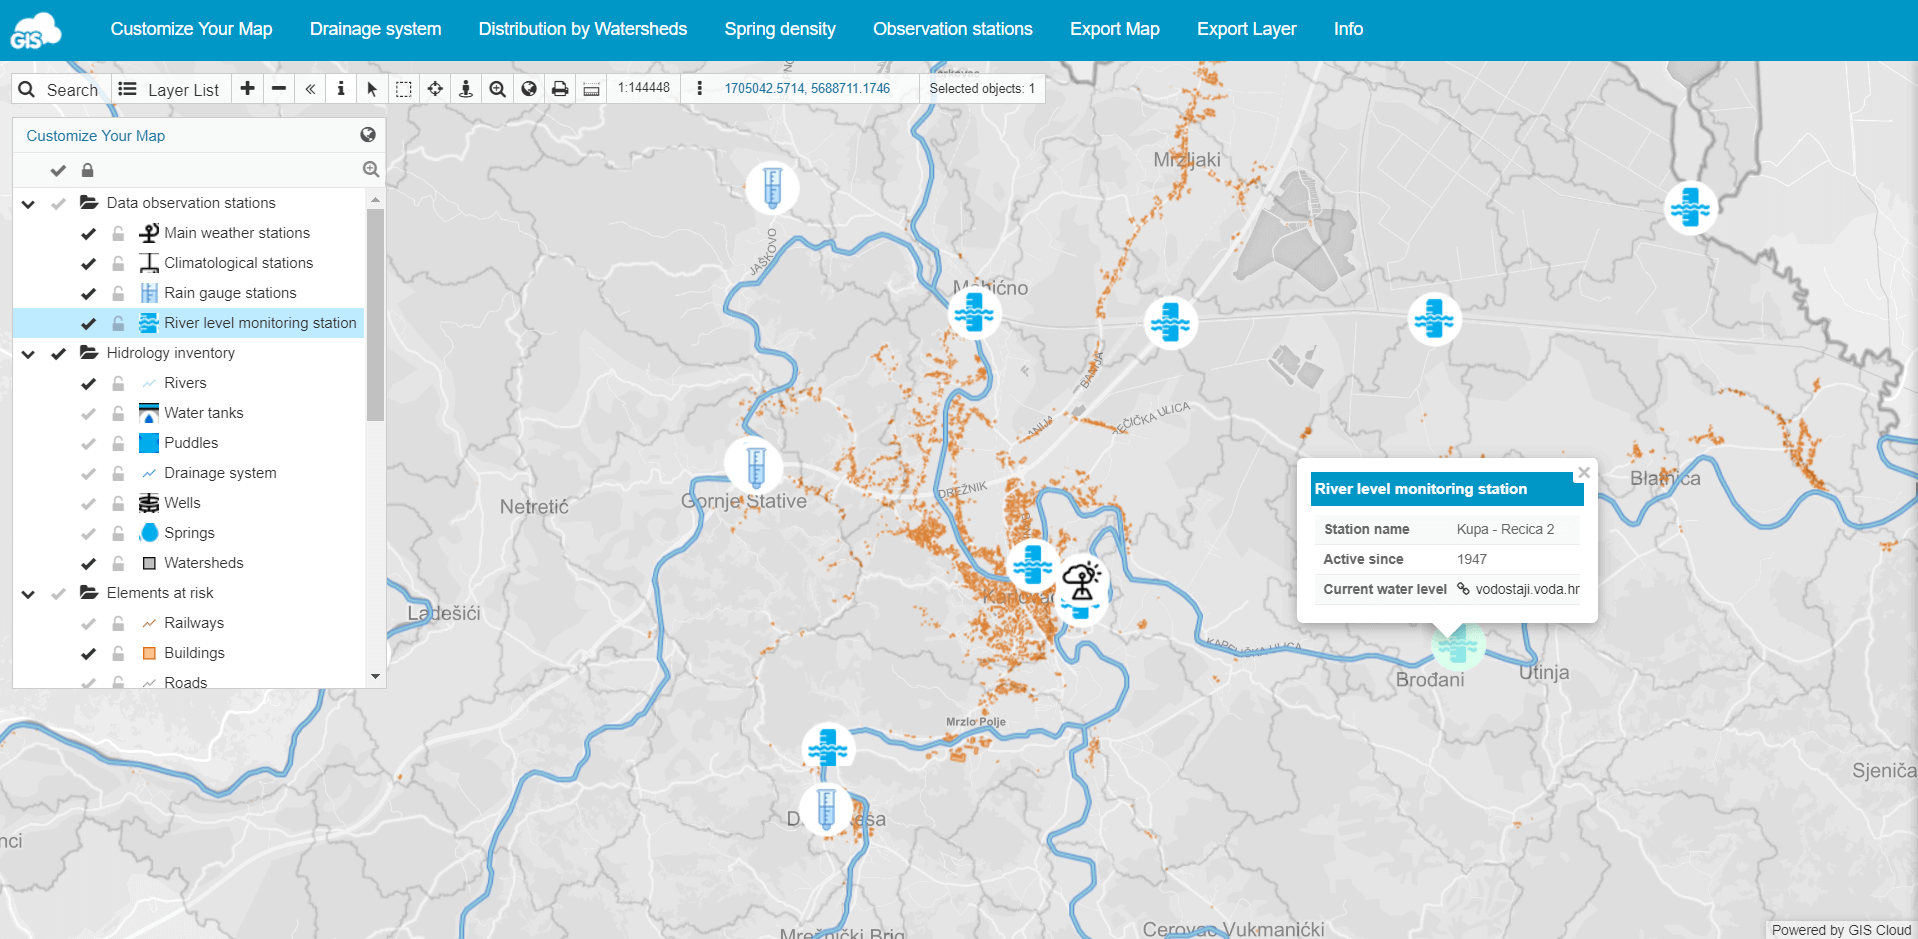
By clicking on the river level monitoring station, a link shows which brings you to a website with current river levels (where available). Overall, tracking river levels and figuring out patterns such as low, medium and high waters is useful for predicting floods. Also, by making virtual monitoring stations between two real ones and interpolating the information with certain statistical methods, one can determine the strength of the hydraulic connection between rivers and groundwater.
Overall, these stations show the user where to access data and at which locations certain data is being monitored. As a result, the needed observation area can be selected and the data collected.
Hydrology Inventory
In this layer group, you can view the natural hydrological phenomenons, as well as water tanks and wells. The map shows puddles, small pools of liquid on the ground, usually created by rain that can be a triggering factor. There are also spring locations indicated on the map, another triggering factor for landslide events.
Watersheds were developed from a digital elevation model using desktop GIS tools. The results are small polygons, when combined with a drainage system provide crucial hydrological information. The drainage system was also made from a digital elevation model and the shown system is a key hydrology factor when determining landslide susceptibility. Usually, multiple buffer zones with different distances are created around the drainage system and each zone is given a different grade for the susceptibility assessment. Similar processes can be done with springs and puddles, depending on the purpose and the study area.
Drainage system distribution is well shown when combined with watersheds layers, as well as with rivers, which essentially are the largest and most simple drainage system.
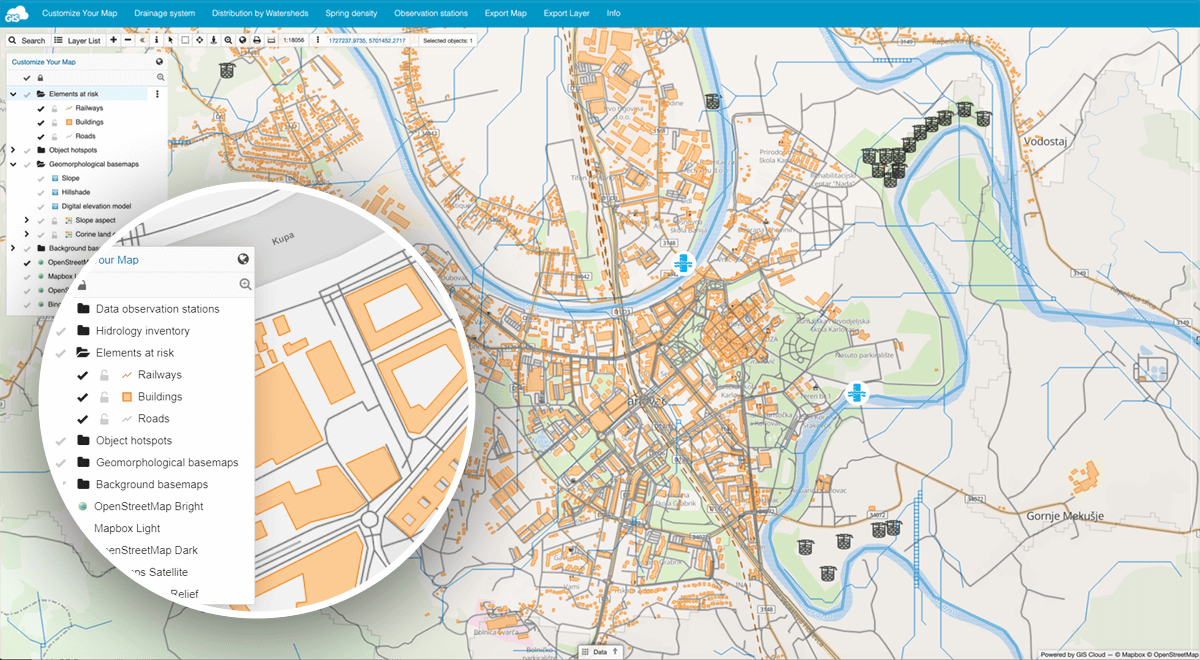
Elements at risk
When doing a risk assessment, elements at risk are essential. For this purpose, railways, buildings, and roads were added for a narrow area of Karlovac, but more objects can be collected by digitizing certain maps, some are even visible on the background basemaps.
Basemap Overview
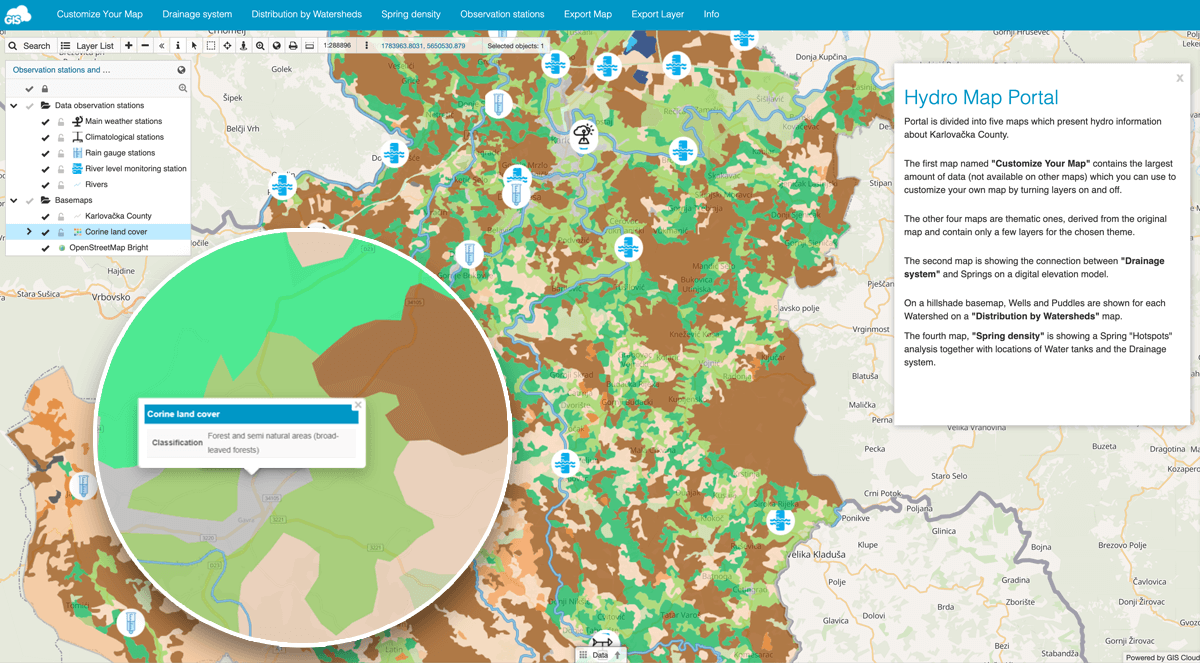
The basemaps on the map portal are split into two groups, one being geomorphological and the other background. Geomorphological include digital elevation model, from which hillshade and slope were created. Slope aspect and corine land cover are vector basemaps which show certain categories. Slope aspect differs depending on the angular orientation of the slope and land cover is split into detailed groups, each represented with different colors. Hovering over the polygon allows the user to read out the category.
Background basemaps are available in the Map Editor and were added to show the bigger area beyond Karlovačka County, as well as a source of plenty spatial information – especially the categorized elements at risk for buildings and roads.
Creating the Map Portal
Once all the geospatial data was uploaded to the Map Editor, it was time to present and visualize the data. A variety of options for visual presentation of vector data such as custom icons made the final output look excellent – simple and informative for both keen experts and the broader public. Last modifications on the layers were made: labels, colors, grouping, overlapping options, etc., and then the portal came into play.
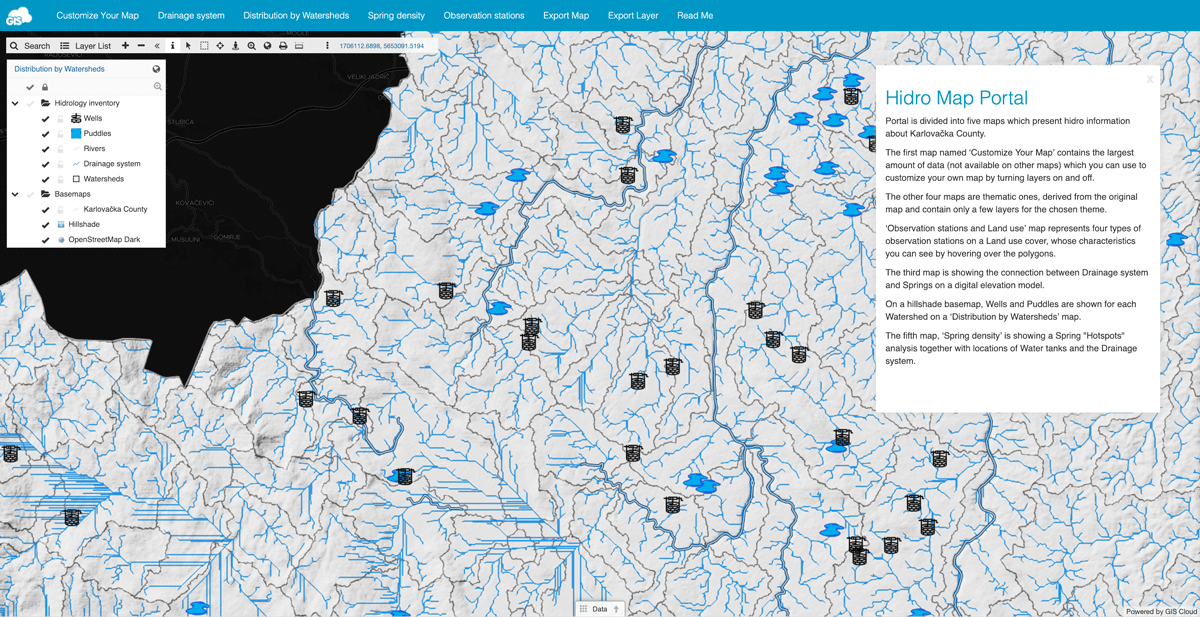
All data can be found in the “Customize Your Map” section and then according to certain goals and themes the data was split into four thematic maps: “Drainage system,” “Distribution by Watersheds,” “Spring density” and “Observation stations”.
Along with many options for the main toolbar, “Export Map” and “Export layer” were added as well. A “Read Me” panel was set to open when visiting the portal, offering a summary and information about the whole project.
Here’s a quick overview of the workflow:
- 1. Choosing default appearance for each layer on the “Customize Your Map” map
- 2. Creating new thematic maps by duplicating the original one and removing excess data
- 3. Making specific appearance settings for every thematic map in the Editor
- 4. Adding maps to the Map Portal
- 5. Customizing the Map Portal (panels, main toolbar…)

Results and Conclusion
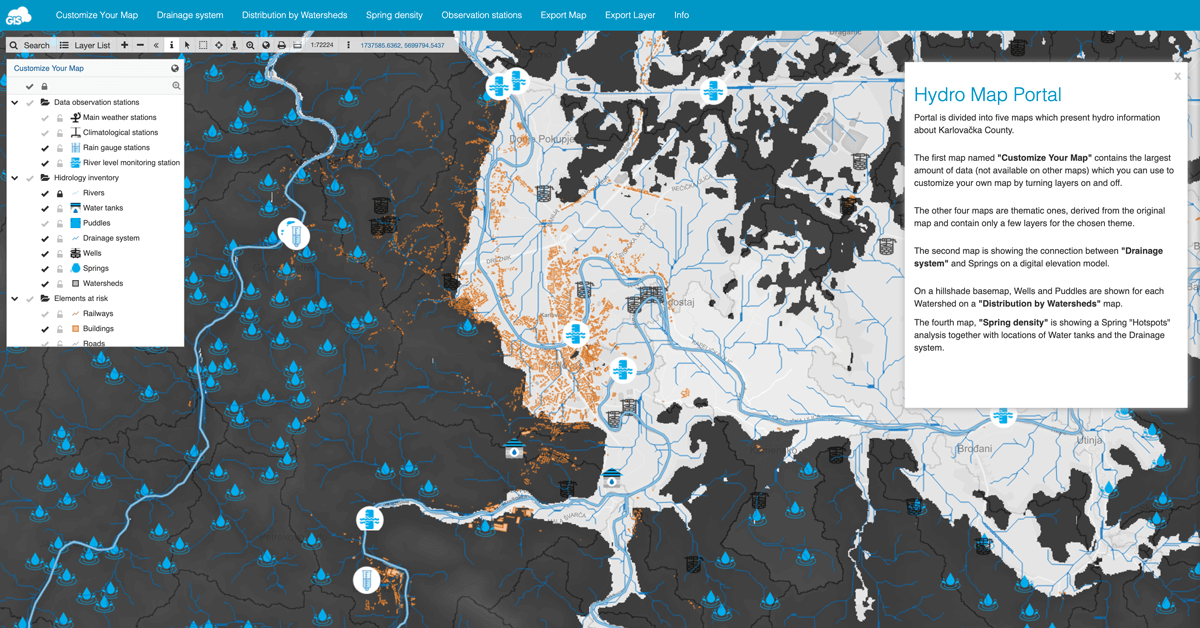
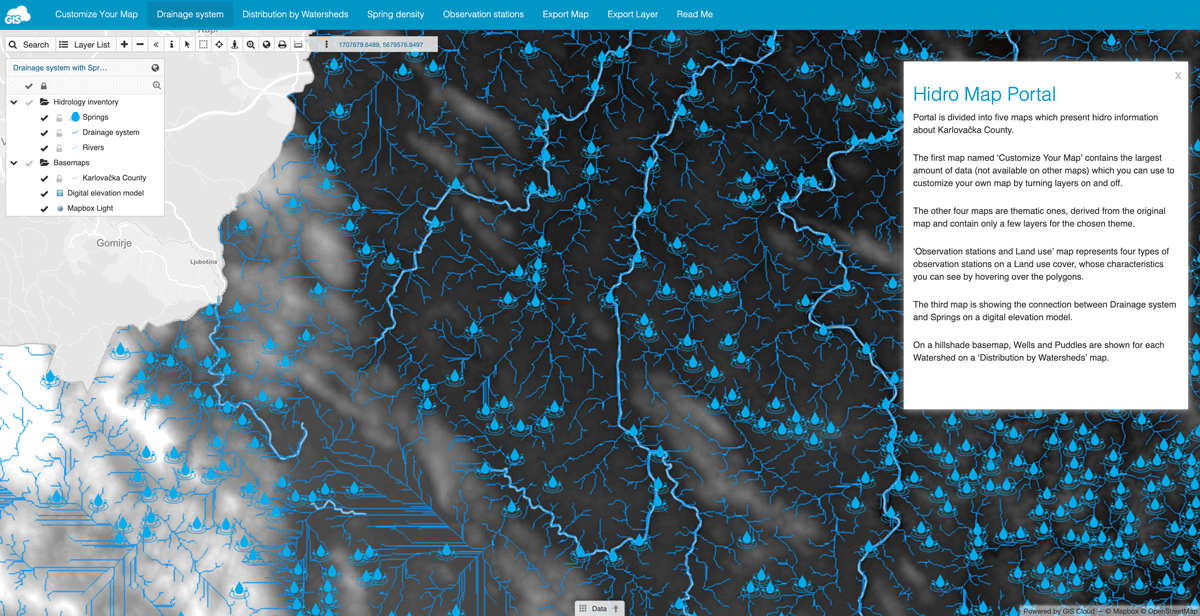
The portal is divided into five maps which present information about Karlovačka County. The first map is called Customize Your Map and it contains the most data (not available on other maps) which you can use to customize your map by turning layers on and off.
The other four maps are thematic ones, derived from the original one and contain only a few layers for the chosen theme. The second map shows the connection of the drainage system and springs on a digital elevation model. On a hillshade basemap, wells and puddles are shown for each watershed (Distribution by Watersheds map). The fourth map, spring density shows the spring hotspots analysis together with locations of water tanks and the drainage system. Observation stations and land use represents four types of observation stations on a land use cover, whose characteristics you can see by hovering over the polygons.

The “Export Map” button on the portal gets you a preview of the map in png format and if you’re interested in individual layers, use the “Export Layer” button. Besides the portal being public, these two options make the data available to download and use for personal or professional use for different purposes. As stated in the introduction, the data provided can be useful in several fields of study, for professionals and scientists, as an integrated resource for hydrological information of Karlovačka County. Customizing your map by choosing which layers to observe or which map to view even non-experts to this topic may find useful.
For questions, additional information, and feedback contact the Map Portal author via email.
If you’re interested in building your own Map Portal send us a message.