Author: Marko Polovina, Frontend Developer at GIS Cloud
Info popup is one of our standard UI components to visualize feature data. By default, the component is available in any GIS Cloud application. But sometimes, we want to customize popups to adjust the style or to integrate with other apps. In that case, we can use API to achieve that.
Before we start, look at our developer’s site and GIS Cloud JavaScript API documentation.
About the data
For our example, we use storm data from the NOAA. The original raw dataset contains the following:
- Lightning strike events that cause loss of life.
- Injuries.
- Significant property damage.
- Disruption to commerce in California for the period 2007 – 2022.
Every event has a location, so it’s easy to display the dataset on a map.
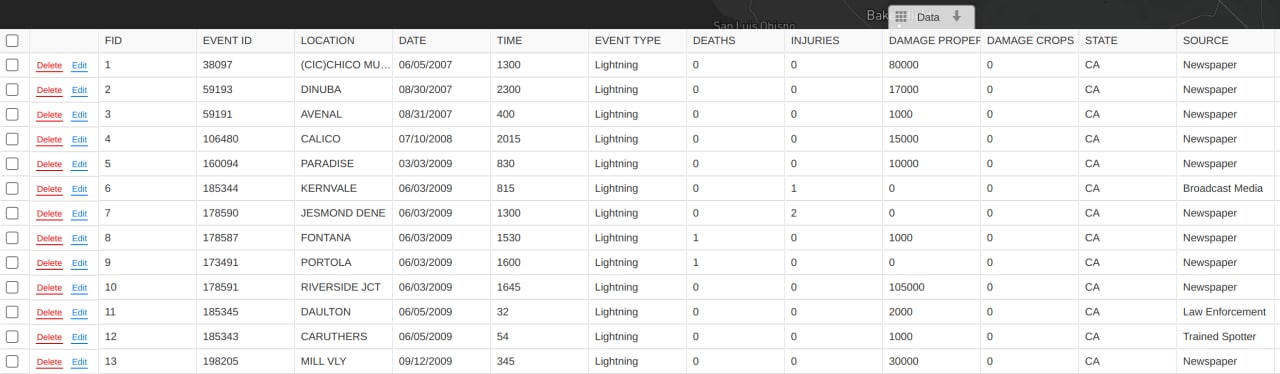
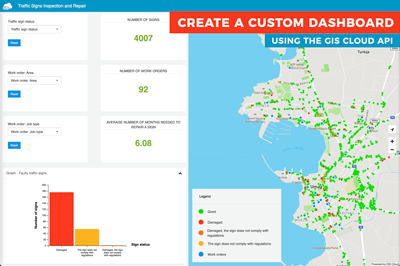
We will focus on a few columns to create an informative portal with clean info popup:
- DAMAGE PROPERTY – damage in US dollars. The goal is to display the Grafana graph as an iframe in the column value. The graph will show the damage of lighting strikes in comparison with others.
- EVENT NARRATIVE – the title of the lighting strikes event, depending on the source. We want to display a link in the info popup that will open a modal window with text.
- EPISODE NARRATIVE – the episode of the lighting strikes event, depending on the source. We want to display a link in the info popup that will open a modal window with text.
- INJURIES – if exists, show the value in red to make it more visible.
- DEATHS – if exists, show the value in red to make it more visible. Also, use animation to create blinking points on the map to make them easier to spot.
Let’s start coding!
It’s time to set up your Map Portal app. To be able to do so, you will need first to upload data and create a map in GIS Cloud Map Editor. Then, go to the App builder application and build your map portal using created maps.
If you need additional instructions on how to create your own Map Portal, take a look at this example or contact us directly.
When your Map Portal is up, your map is populated with data, and you are done with the initial portal customization and branding, it’s time to start coding.
Get data from layer
giscloud.features.byLayer(, {
   geometry: "wkt"
}).done(function(features) {
   console.log(features);
   // ...
});
- change layerId with your layer id
- get geometry for a feature in WKT format; it’s possible to get features without geometry
Create points on the map
features.forEach(function(feature) {
   var pointGraphic = {
       color: new giscloud.Color(0, 0, 0, 100),
       fill: feature.data.DEATHS && feature.data.DEATHS !== "0" ? new giscloud.Color.fromHex("e6312e") : new giscloud.Color.fromHex("3a2ee6"),
       size: 8,
       border: 2,
       shape: "circle"
   };
   var pointStyle = new giscloud.GraphicStyle(pointGraphic);
   var point = new giscloud.GraphicFeature(giscloud.geometry.fromOGC(feature.geometry), pointStyle);
   giscloud.ui.map.graphic.add(point);
   // ...
});
- create points with blue and red colors, depending on the DEATHS column value
- the shape can be a circle or square
Add animation to red points
if (feature.data.DEATHS && feature.data.DEATHS !== "0") {
   $(".leaflet-marker-pane .leaflet-marker-icon:last-child").addClass("animated-icon");
}
.leaflet-marker-icon.animated-icon {
   animation: highlight 2s linear infinite;
}
@keyframes highlight {
   0% {
       width: 8px;
       height: 8px;
       opacity: 0.3;
   }
   50% {
       opacity: 1.0;
   }
   70% {
       border: 1px solid rgba(230, 49, 46, 0.5);
   }
   100% {
       width: 18px;
       height: 18px;
       opacity: 0.3;
       border: 1px solid rgba(230, 49, 46, 0.2);
   }
}
- add animated-icon class to point element on the map and then apply CSS animation
Enable info popup on point click
point.bind("click", function() {
   gcapp.selo.showRecordInfo(this.feature, false, giscloud.geometry.fromOGC(this.feature.geometry));
});
Change info popup values before render
gcapp.selo.addEvent("beforeshowrecordinfo", processPopupDataBeforeRender);

function processPopupDataBeforeRender(evt) {
   $.each(evt.tabledata, function(fieldIndex, item) {
       switch(item.fieldName) {
           case "event_type":
               // change column name from 'event_type' to 'EVENT TYPE'
               item.name = "EVENT TYPE";
               break;
           case "TIME":
               // change TIME column format from 830 to 8:30
               item.value = item.value.substr(0, item.value.length - 2) + ":" + item.value.substr(item.value.length - 2);
               break;
           case "DEATHS":
               // add red color to column value if value bigger then 0
               if (item.value !== "0") {
                   item.value = "" + item.value + "";
               }
               break;
           case "INJURIES":
               // add red color to column value if value bigger than 0
               if (item.value !== "0") {
                   item.value = "" + item.value + "";
               }
               break;
           case "EVENT NARRATIVE":
               // change column value to link with onclick event
               if (item.value && item.value !== " ") {
                   activeInfo.eventNarrative = item.value;
                   item.value = 'View';
               } else {
                   item.value = "NONE";
               }
               break;
           case "EPISODE NARRATIVE":
               // change column value to link with onclick event
               if (item.value && item.value !== " ") {
                   activeInfo.episodeNarrative = item.value;
                   item.value = 'View';
               } else {
                   item.value = "NONE";
               }
               break;
           case "DAMAGE PROPERTY":
               // load Grafana chart
               item.value = '<iframe src="https://nagios1.cld.gcld.io:3002/d-solo/lrdGEid4z/storm-data?orgId=3&from=1668656457358&to=1668678057358&panelId=2" width="300" height="120" frameborder="0">
  DAMAGE = ' + item.value + '$';
               break;
       }
   });
}
- in processPopupDataBeforeRender function, we can change the tabledata array and display new attribute values or names in the info popup
- attribute value can be any HTML element
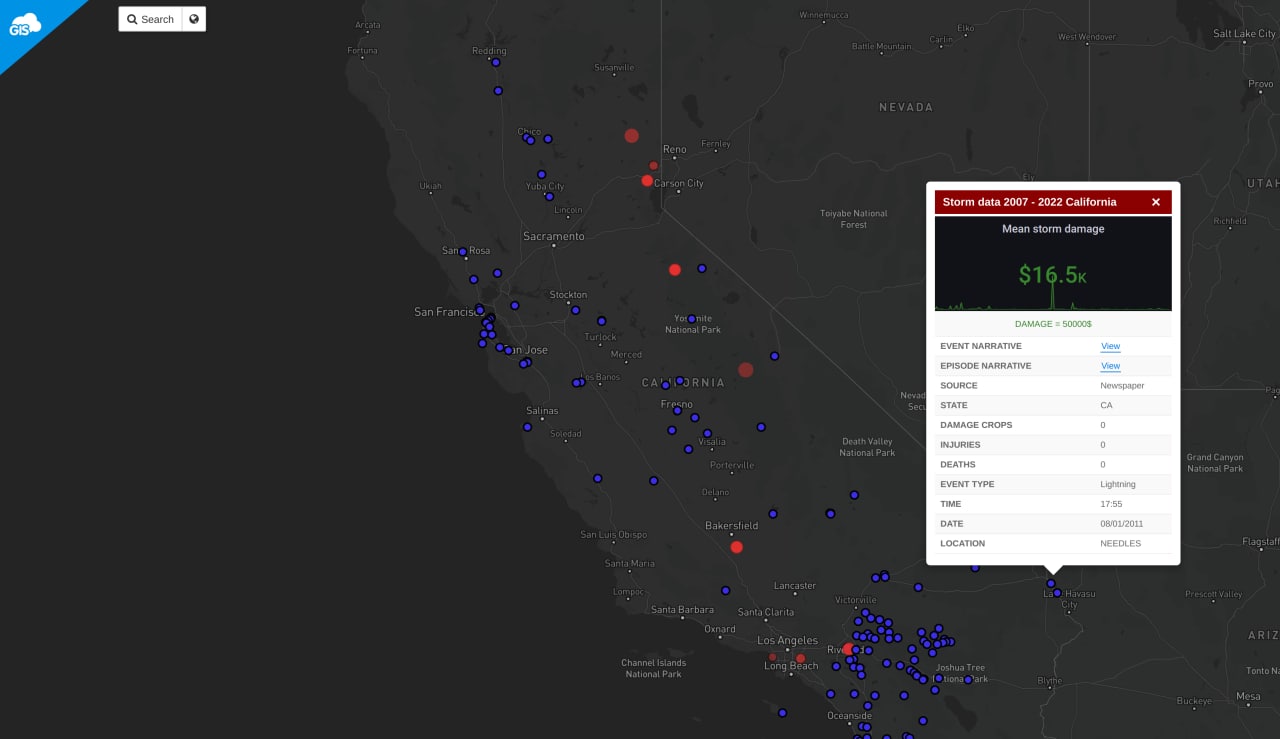
FINAL RESULT
This blog post showed you how to create a custom portal to visualize lightning strike events and get a decision-making tool. Take a look at the final result: Map Storm Data 2007 – Example
You can find our last development blog post here.
Also, don’t hesitate to contact us if you have any questions, comments, or ideas for a new development example. And if you need any help with development, take a look at our Services page.
Happy coding!