
COVID 19 is quickly spreading in the Philippines at an alarming rate. At this point, efforts to contain the virus depend on a contact tracing technology. The University of Cordilleras – Research and Innovation Office (UC-RIO) in Baguio City has developed a system powered by GIS that enables real-time reporting, inter-agency data sharing and geographic visualization of COVID 19 cases in Cordillera Administrative Region (CAR)
After our offer at the beginning of the pandemic, that GIS Cloud will provide free technology and support to projects fighting the Coronavirus, we received numerous emails with worthy projects around the world!
In this article, we bring you a case study on one of these projects in collaboration with Engr. Nathaniel Vincent A. Lubrica from one of Philippine’s universities.
We encourage people and organizations to reach out and present their project to us, so we could provide them with free licenses and support to set up systems such as public map portals, data collection projects and crowdsourcing. Engr. Nathaniel Vincent A. Lubrica of UC-RIO contacted us about his project of tracking and mapping the COVID 19 outbreak in the Philippines.
In this partnership, they implemented a platform for real-time mapping, reporting, data collection, analysis and surveillance of COVID 19 cases.
All of the collected data in this project is transformed into various types of maps to visualize cases and provide more in-depth insight on the situation to enable planning of effective response such as contact tracking and helping the community.

“The project aims to develop a harmonized framework of data collaboration to aid in informed and data-driven decision making.”
Engr. Nathaniel Vincent A. Lubrica of UC-RIO
Engr. Lubrica’s initial concept was to:
- map places that COVID 19 positive patients visited
- map which areas were sanitized
- indicate if the people in contact were tested
This effort will help the country to gear up for transition towards the “New Normal”.
It will help and aid the Local Government Units ( LGUs) to upgrade their disaster risks assessment efforts, such as the identification and extent of affected areas and the assessment of damages caused by any natural disaster in the future.
Engr. Lubrica sent us his report on the fight against COVID 19, and we are bringing you this exciting case study describing the steps of their workflow.
Project Report Outline
- Project Objectives
- Problems, Goals and Benefits of Mapping Virus Outbreak
- Project Milestones / Activities and Accomplishments
- Starting Point
- Utilizing the GIS Cloud Platform, Field Data Collection and Data Sharing
- Workshops on Setting-up a GIS supported Workflow
- “BLISTT Stranded Students” project integration
- Training on Data Entry, Data Sharing and Online Collaboration
![]()
Real-time information on COVID 19 cases is essential in the planning and response efforts of government units. Information is power in decision making. No one goes to “war” without a map!
Engr. Nathaniel Vincent A. Lubrica of UC-RIO
Project Objectives
The main objective of the project is a multi-stakeholder collaboration and data-driven decision making optimizing the use of a real-time web GIS platform and data analytics.
Specifically, the project aims to attain the following:
- Establish harmonized guidelines on COVID 19 data management;
- Set-up a data value chain for COVID 19;
- Develop a framework for citizen engagement through participatory GIS;
- Provide capacity building activities in the areas of GIS and data analytics; and
- Develop data-driven decision making using an integrated multi-stakeholder real-time web GIS platform.”
Problems, Goals and Benefits of Mapping Virus Outbreak
According to the project leader Engr. Nathaniel A. Lubrica, the project has a unique approach of providing a custom-fitted, inter-agency technological platform through integrated map collaboration and citizen engagement. The project also expanded in different stages, through building project capacity from data management to advanced simulation.
There are several mapping applications developed for COVID 19. However, only a few consider a real GIS assisted approach. Spatio-temporal analysis of COVID 19 is helpful in decision making. Engr. Lubrica’s team also realized that an integrated approach for COVID 19 surveillance and reporting does not exist at the moment. That’s why Engr. Lubrica contacted GIS Cloud and applied his project so that 1.35 million Cordillerans can benefit from this study.
He said that this project could be scaled up to a national level. Collaboration across Local governments units (LGUs), government agencies, NGOs and the public is essential, and they can all contribute their knowledge and expertise to benefit from it.
There is no limit on the information that will be captured and displayed in these maps. Hence, further investigation revealed that the public feels safer and more engaged through the GIS platform of this project due the availability and visualisation of the data in Map Portal – a public GIS app displaying real-time information. Data ethics and privacy regulation are taken into consideration during this project.
Engr. Lubrica also agrees that the initial platform of this project can be used in the future for prevention of other disasters.
We will walk you through his workflow and accomplishment to give you a general idea and fantastic possibilities this project offers. Let’s dig in together and find out how they utilized GIS Cloud solution in this case.
Project Milestones, Activities and Accomplishments
Starting Point
The starting point of Engr. Lubrica’s project was providing his team GIS Cloud subscriptions for various apps:
- Mobile Data Collection – for collecting data in the field
- Map Editor – for organizing, editing and sharing data
- Map Viewer – for easy private access to the data
- Map Portal – for public access and data representation
In this initial period, his team created user accounts in GIS Cloud Manager and started exploring and learning possibilities that our applications provide.
For desktop mapping needs, Engr. Lubrica and his team used QGIS software, which integrates great with GIS Cloud plugin for map publishing.
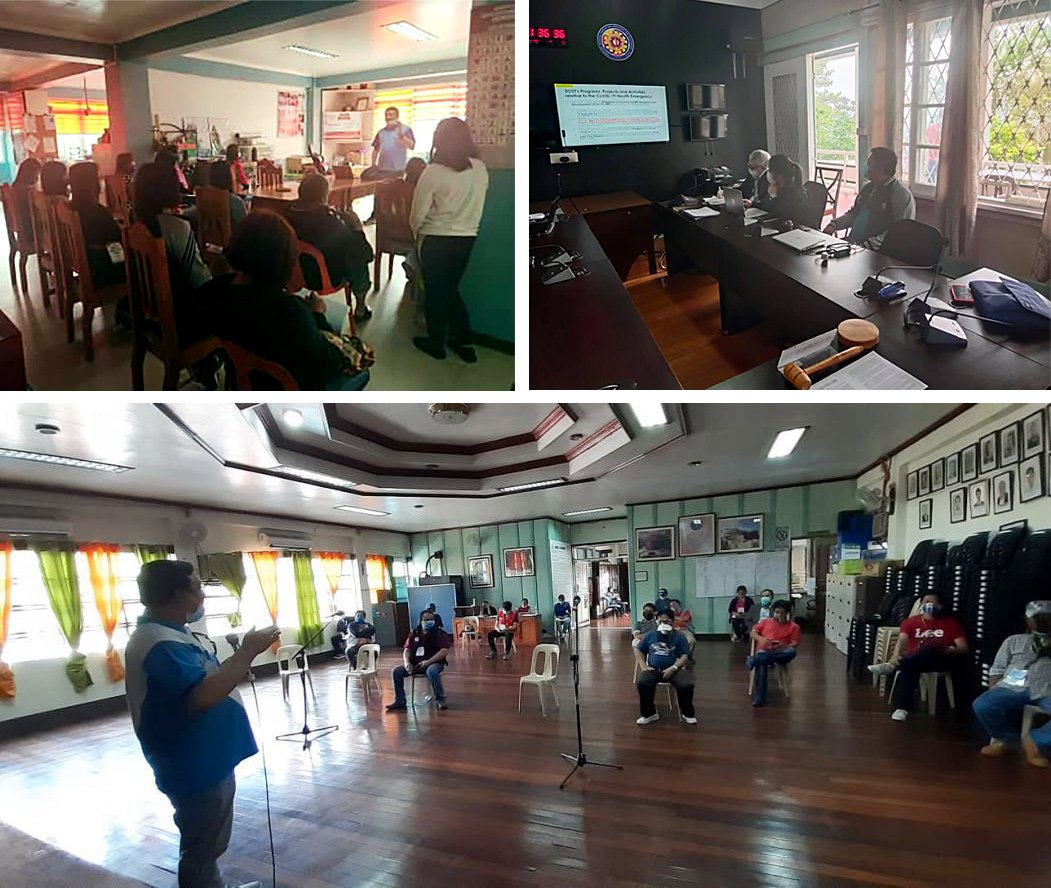
The team presented the COVID 19 project and the use of the GIS Cloud platform in a meeting with LGU Baguio city, Department of Health (DOH-CAR), and the Baguio City Health Services Office (BCHSO).
During their meeting, they reached different inputs and ideas in support for the future project development and implementation, said Engr. Lubrica.
Additional GIS Cloud accounts were created for participants of this meeting, and the Regional Director of the Department of Science and Technology – CAR, Nancy M. Bantog, expressed her full support!
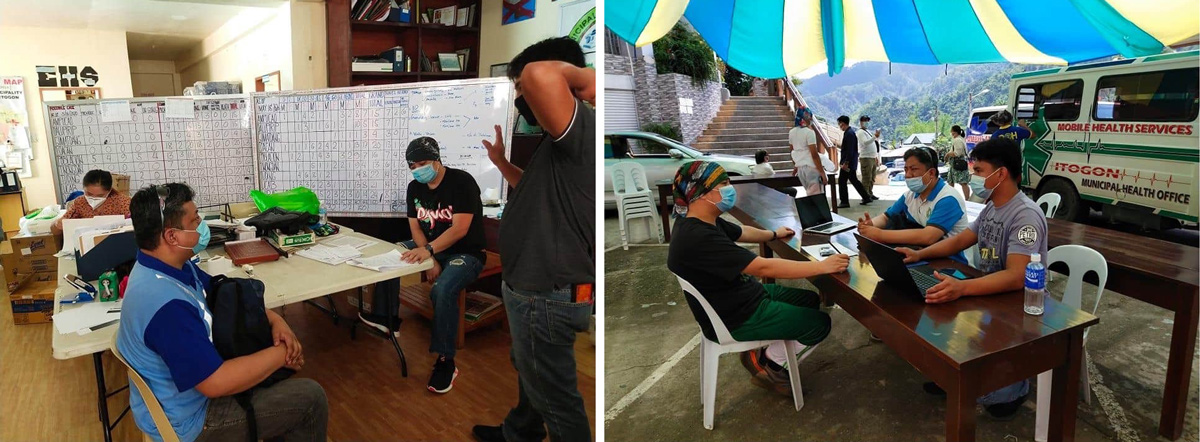
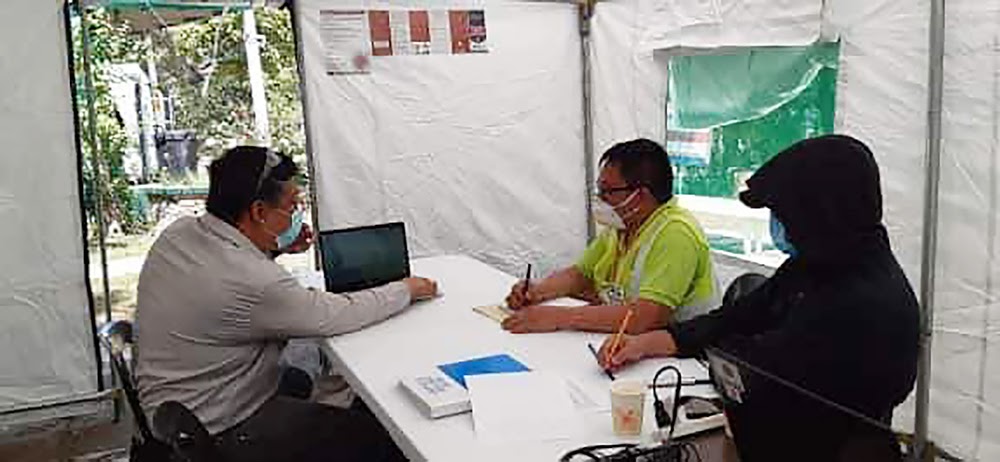
Also, they promoted the project at the DZRK-AM Radyo Pilipinas (Radio Station) in the city of Tabuk. Engr. Lubrica talked about GIS technology and GIS Cloud apps that they are using for COVID19 surveillance and mapping.
Utilizing the GIS Cloud Platform, Field Data Collection and Data Sharing
Engr. Lubrica’s team dug further into the exploration of the GIS Cloud platform. They set up more Mobile Data Collection accounts, for real-time field data collection and visualization, and analyzed in depth more of Map Editor’s collaboration and sharing capabilities. Engr. Lubrica coordinated with our CEO, Dino Ravnić, who granted a new package of subscriptions in support of their project.
With these extra licences, he empowered volunteers to help collect more data in the field. This way project managers can gain immediate insight into where to send help or close out areas, just by looking at a map.
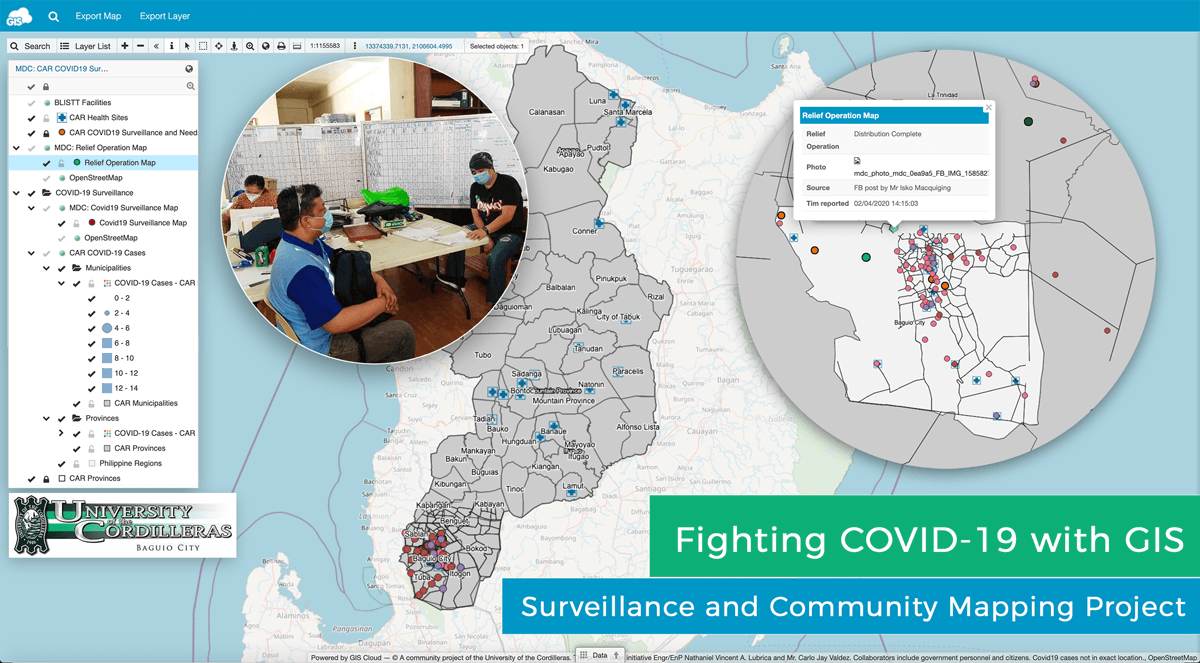
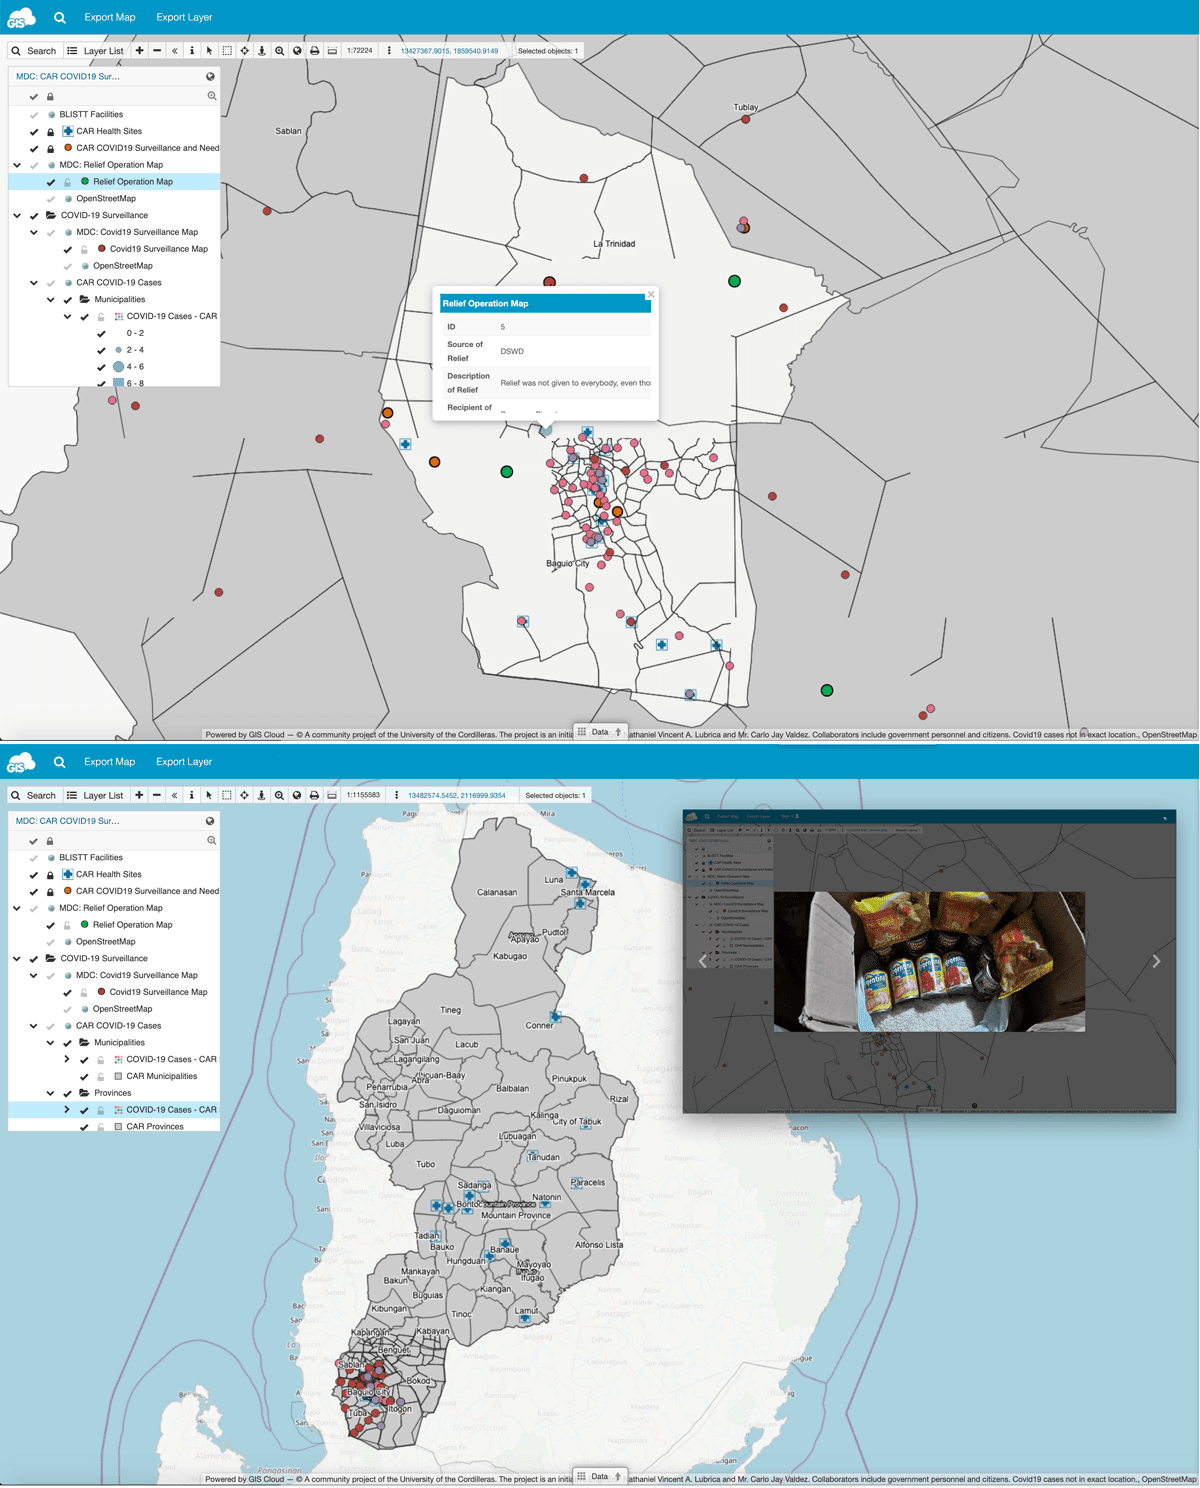
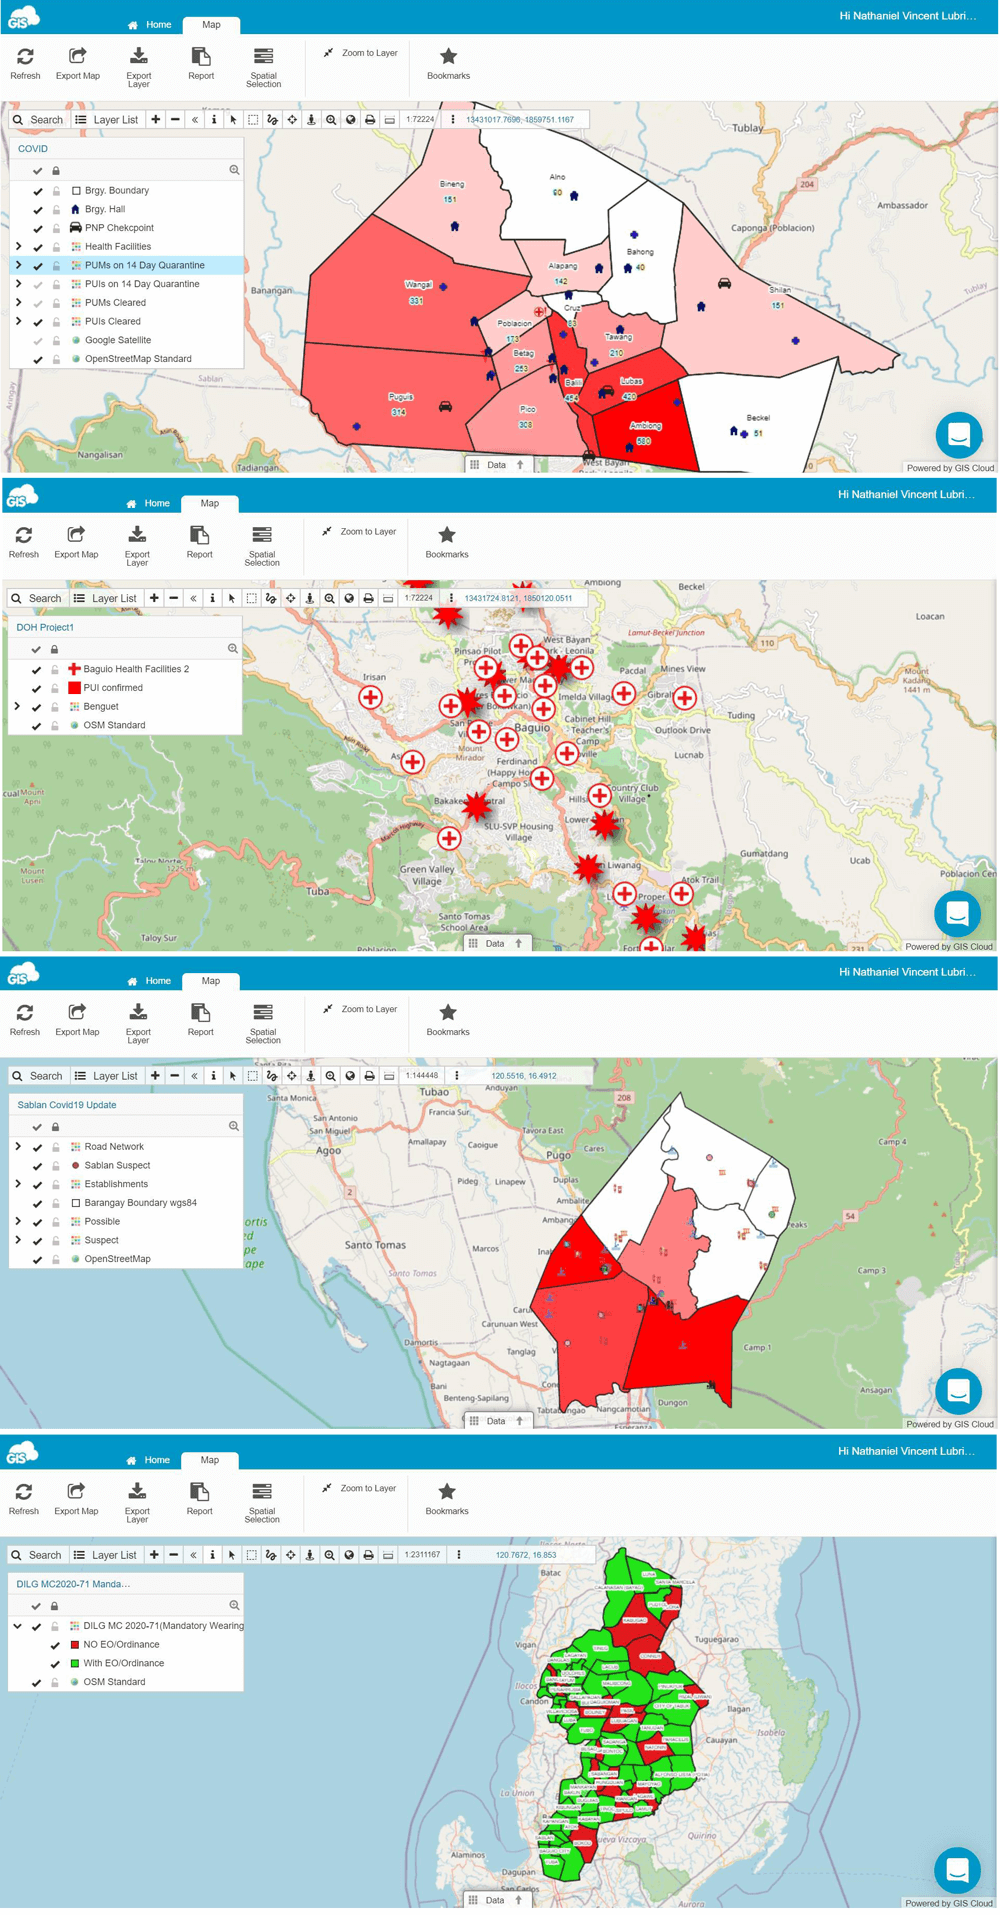
The result is a COVID 19 Reporting and Surveillance and Map Portal made by Engr. Lubrica and his team. In this public GIS app, they visualised CAR municipalities and provinces in relation to all of the active CAR Health Sites on the map. Thanks to that, they were able to establish points of Relief Operations to track and oversee positive COVID19 people in the region.
In the future, this information will help to locate patients and address them to the nearest Health Centers in a specific area!
Also, with this Map Portal, they can track and supervise what necessary provisions (medicine, food, shelter..) did the people take into consideration in the fight against COVID19. They can advise them on further developments and what actions they need to take into consideration on virus suppression in the future.
The team started the project presentation and meetings held at the Office of Civil Defence (OCD) and the Department of Science and Technology. Director of the Office of Civil Defence, Albert A. Mogol, as well as other participants, endorsed the project and together they formulated an initial framework and deployment plans.
Engr. Lubrica also participated in the “contact tracing” meeting with Baguio city LGU. He introduced the GIS Cloud platform and his COVID 19 project and conducted a demo-workshop with Baguio heads of health groups. They all agreed that the usability of the platform is friendly and beneficial, and it will be of high value to their city.
In a utilization meeting with the Office of Civil Defence and Baguio City LGU, they addressed the advantages of the GIS Cloud platform with the focus on the main benefit:
- user-friendly applicability
- easy deployability
This is a confirmation that applications are intuitive, easy to use. Project managers can rely that the volunteers and personnel who are using apps will properly perform their tasks. Not all LGUs or Agencies have personnel who have high IT literacy, so crowdsourcing and dashboard features of GIS Cloud platform are very convenient in their case.
Engr. Lubrica organized additional meetings, orientations, needs assessments, and workshops with LaTrinidad LGU’s local teams. Teams that joined the cause at this stage were:
- Disaster risk reduction and management,
- Health services
- Social services
- Planning and development
The project was presented to the La Trinidad COVID 19 EXECOM (Executive Committee) composed of the mayor, vice-mayor, the councillors, and all municipal department heads. The Executive Committee through mayor Romeo Salda endorsed the implementation of Engr. Lubrica’s COVID 19 project for La Trinidad, which was a confirmation of the successful project setup.
Workshops on Setting-up a GIS supported Workflow
An orientation-workshop and education were held with the barangays (smallest political units) of La Trinidad, explaining the importance and workflow of the project.
Within just a few hours, all of the participants were able to adopt the workflow and successfully report their cases using the GIS Cloud platform!
“This again proves that the GIS Cloud applications are user friendly and well suited for people with less knowledge in the IT industry.”
Engr. Nathaniel Vincent A. Lubrica of UC-RIO
In this period Engr. Lubrica and the members of PROJECT CARES (Cordillera Assessment and Resource Generation) discussed the importance of mapping the COVID 19 areas. Also, a large agglomeration of the city Baguio and municipalities of Benguet, La Trinidad, Itogon Sablan, Tuba and Tublay (BLISTT) joined the CAR COVID 19 Surveillance and Community, and Engr. Lubrica was able to present the project to them. The BLISTT Council welcomed this initiative, and he and his team received positive feedback for their perseverance and goodwill.
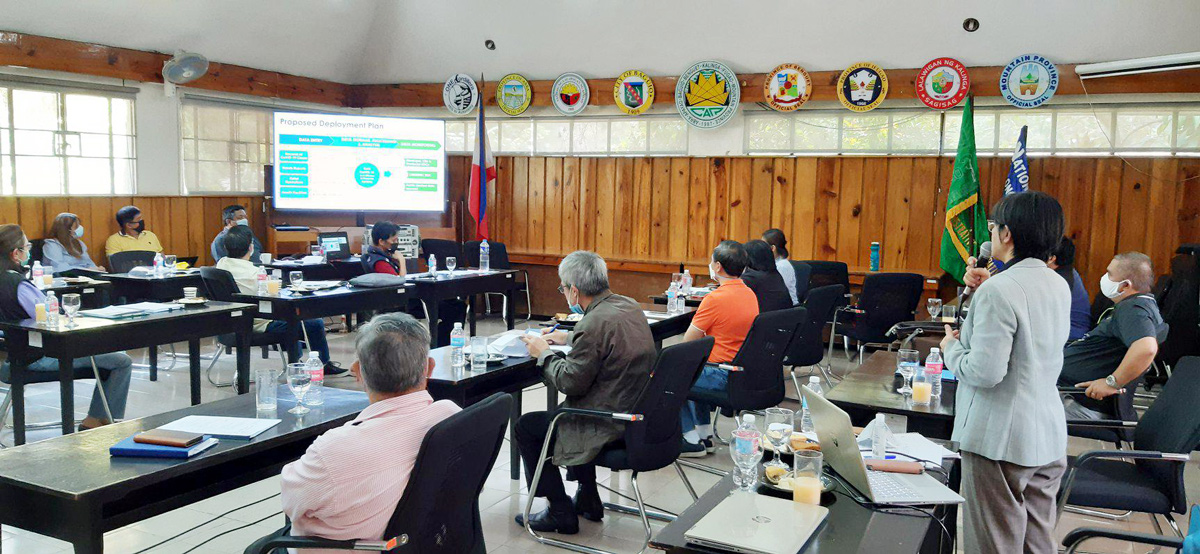
It was recommended that the project should be integrated with the contact tracing system of Baguio city.
“BLISTT Stranded Students” project integration
The “BLISTT Stranded Students” project helped 249 students without access to the internet and health care to be identified and directed to health institutions with the help and assistance of the citizens in this area.
The project was presented to the Department of Health (DOH) and the Department of the Interior and Local Government (DILG) CAR, with all department heads and technical staff present. Both the regional directors of DOH and DILG expressed full assistance for the project’s potential and field reporting. Data being collected will be used to locate stranded students, assess their situation, and launch well-coordinated and strategic relief operations with the help of GIS Cloud apps and support.
It was settled that the two organizations will send their representatives on the CAR COVID 19 Surveillance and Community Needs.
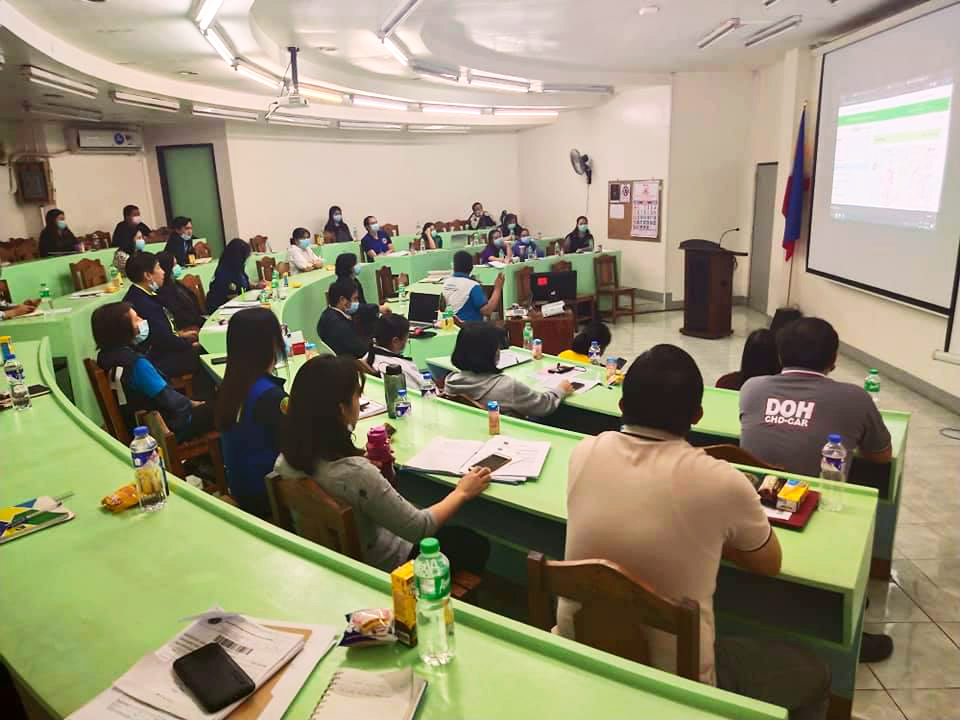
Training on Data Entry, Data Sharing and Online Collaboration
The training’s activities included registration to GIS Cloud accounts, a workshop on harmonization of COVID 19 framework, GIS orientation and lectures, hands-on training on QGIS and GIS Cloud, and workshop on creating maps. Engr. Lubricas team is creating maps in QGIS to compose and analyse maps. Thanks to GIS Cloud Publisher for QGIS, Engr. Lubrica’s team has a chance to publish and update QGIS maps online, preserving their symbology and collect data from the field directly into published QGIS maps.
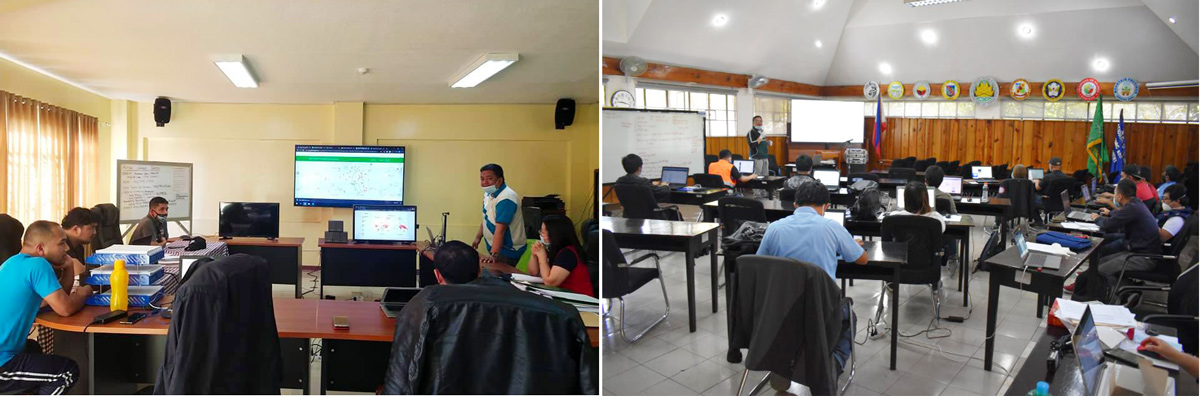
The success of the training proves that the project and its workflow are very well thought out and on the point.
The results of the training are these interactive maps:
The expected outputs of the 2-day activity are the following:
- Creating guidelines on data entry and sharing
- Working knowledge of GIS and GIS Cloud
- Implementation of the system per LGU/NGA
A total of 18 participants from the following organizations attended and successfully completed the training: LGUs of La Trinidad, Itogon, and Sablan; and regional government agencies which include DOST, NEDA, OCD, DOH, DSWD, and DILG.
This was just Stage 1 of the training.
- Stage 2 will deal with the creation of information and data engineering in the future
- Stage 3 will include predictive analytics
- Stage 4 will consist of optimization
After this Stage 1, Engr. Lubrica and his team made the Map Portal with all the municipalities and health centres in the region so that they can help the local population with the fight against COVID 19. In the future they plan to upgrade their project into a risk assessment tool, so they can identify affected areas and evaluate damages caused by any natural disaster.
We at GIS Cloud felt a need to get involved in the COVID 19 pandemic fight by offering technology and support to all of those who wish to make a change.
We congratulate Engr. Lubrica and his team on their immense effort and great achievements in the fight against COVID 19. We will continue working with him and the university to help suppress wider viruses spread in the Philippines.
Please contact us if you wish to find out how to use the GIS Cloud platform to fight COVID 19 and other potential health risks.