
Target the hotspots that matter
Bring infrastructure, leaks, incidents and water quality onto one live map. Register assets, inspect in the field, and prioritise the ~20% of assets behind most of the problems, instead of fixed routes.
Why digital assets & operations
About 20% of assets cause about 80% of problems
Full, up-to-date information on critical assets, from treatment plants and distribution systems to reservoirs and storage, is what lets you understand cost, risk, service options and where to expand.
But asset data, incident logs and planned works usually live in different places. Some assets are clearly higher cost and higher risk; the job is to find them and act on them first.
GIS Cloud portfolio
Four water domains, one platform
Water Infrastructure Management
Create or update your geospatial database of pipes, valves, pumps, hydrants and reservoirs, and coordinate the maintenance around them.
- Asset registration & condition update
- Field-crew coordination & site navigation
- Work preparation, job assessment & verification
Leak Detection & CCTV Inspections
Map and classify leaks and CCTV inspections, request work and keep field crews coordinated and available.
- Leak & CCTV classification maps
- Crew coordination & availability
- Inspection request & verification maps
Emergency & Issue Response
Visualise reported issues to locate the origin, prioritise repairs in a disaster, and keep customers informed.
- Issue response on a live map
- Disaster response & repair prioritisation
- Customer portals with up-to-date info
Water Quality & Watershed
Spot contamination risk, analyse water-quality trends and assess the impact of infrastructure and environment on quality.
- Identify potential contamination areas
- Analyse water-quality trends
- Assess infrastructure & environmental impact

From asset register to maintenance
- 1Register & update: pipes, valves, pumps, hydrants and reservoirs go into one geospatial database with consistent IDs.
- 2Coordinate crews: site navigation, location information, work preparation and job assessment, all from the map.
- 3Verify work: completed jobs and condition updates sync back, giving supervisors real operational visibility.
Powered by GIS Cloud AI
Ask where the risk concentrates
“Show gullies with repeat flooding near schools.” GIS Cloud AI queries your asset and incident layers and maps the overlap. You review and confirm; nothing is changed without you.
Explore GIS Cloud AIThe GIS Cloud approach
Fast results, low risk
Fast results & low risk
Start at department level to minimise initial cost and risk, then scale up or down: a modular approach aimed at specific business results.
High adoption rate
A 3–5 day learning period, a simple UI and great UX, and the fastest map engine available, on both mobile and desktop.
Embrace & extend
Acts as the glue between tools you already run, including BSS, CMMS, EAM, OSS and desktop GIS, embracing existing systems and extending them to every level.
The toolkit
Apps that power water utilities
Case study
Liburnian Waters
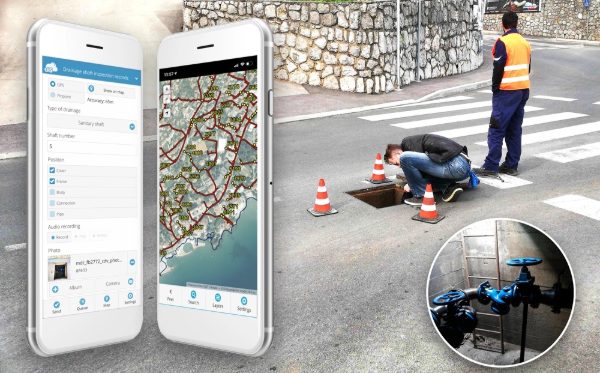 Liburnian Waters · Croatia
Digital transformation · Field operations
From paper rounds to a real-time map of the network
“GIS Cloud was a logical solution for a number of reasons, the most important being the price model, user support, and the ease of use.”
- Faster data collection: the new field process cut the time needed to capture asset data.
- Real-time access: live data let teams plan operations and prioritise tasks more efficiently than ever.
- Wider collaboration: cloud data opened spatial layers to local government units and citizens.
Related reading
Water-utility use cases

Map your network,
target the worst first
Consolidate one asset group and run risk-based inspections this month. No credit card, no setup.