How much does your telecommunication network cover? How many customers are within your reach? Where are your oldest assets?
A quick analysis in Map Editor can provide you with all the answers.
A service coverage and gap analysis can identify the areas your telecommunication network covers. It will also show you the customers you have missed.
How many more customers could you reach with your next investment? The decision-makers in your organization can use this powerful tool to make informed choices.
In Map Editor, you can use different analysis tools to obtain this information.
Telecommunication Network Digitization
It begins with a digitized telecom network. After you have digitized your network’s assets, you’ll have many powerful tools at your fingertips.
A digitized telecom network is a representation of assets in a digital environment. In GIS Cloud, your real-world assets can be located, cataloged, and viewed remotely from your desktop.
These digital assets are accurately located worldwide and contain the unique information attributed to each. Attributes may include information such as text, numbers, or dates.
With no limit in attribute fields, you can capture any information you’d like about the asset. This can include:
- Date installed
- Make and Model
- Size
- City
- In or Outside of Encumbrance (Y/N)
- Median Income
- Asset Value
- Maintenance Schedule
Our solution consultants can help you digitize your network and build out the fields you’d like to capture.
There are many advantages to a digitized telecommunication network:
- Instant view of assets
- Location-based Asset Inventory
- Remote Asset Management
- Data Analytics
- Maintenance Planning
These advantages pay off immediately. And with GIS Cloud, you can share your new tool with your organization.

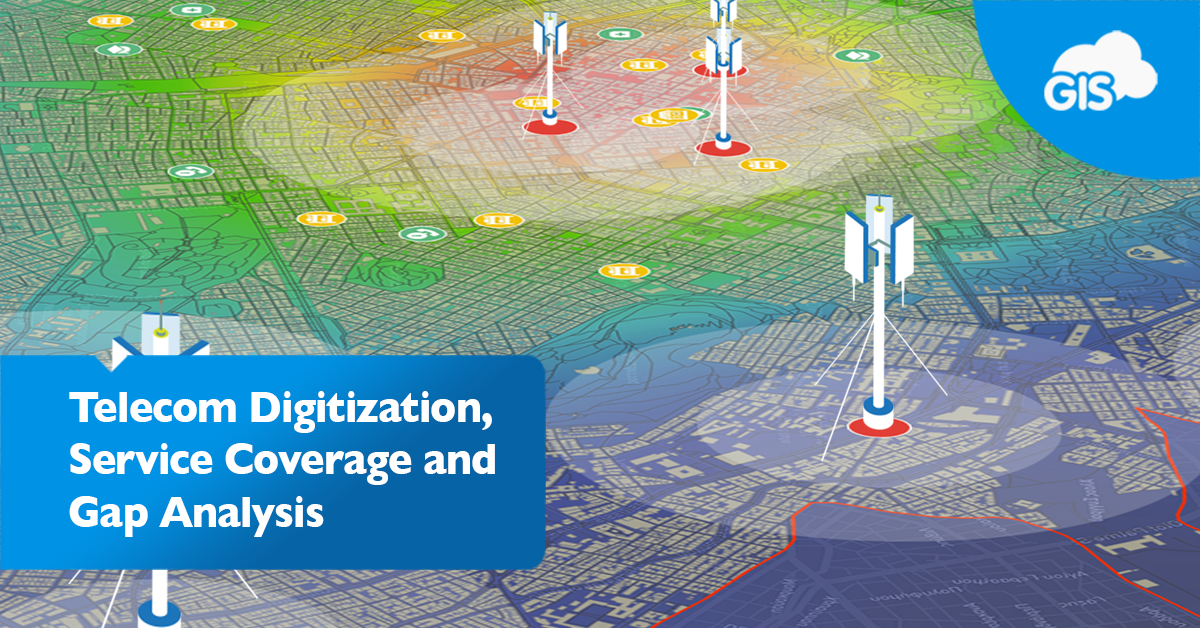
Mapping Coverage and Connectivity
Using your GIS-centric network, you can perform analysis to guide your business decisions.
GIS Cloud’s Analysis tools allow you to view your network’s coverage from a different perspective and give you instantly usable data.
Within the Map Editor application, we will use the buffer tool.
Selecting the Buffer icon under the Analysis tab opens the Buffer Analysis. Select the layer you’d like to analyze. In this case, we are mapping out the coverage of each of our towers.
We can also select to fill in the buffer to create one polygon for any overlapping buffers.
After running the buffer tool, we will have an accurate view of each tower’s range and the network’s total coverage. The results can be used to find service gaps and potential future tower sites.
Identifying Service Gaps
A gap analysis identifies where something is missing. In water utilities, that may be what pipelines are missing easement rights. In inspection services, it may be who covers what neighborhoods in the country. And in telecom, we are identifying network coverage.
The buffered tower site data analysis shows us the area covered. By itself, that doesn’t provide a lot of information.
You can bring in other data types to get a more comprehensive analysis.
Adding in a parcel layer will show you how many properties are covered. If you have a building layer, that will provide you with a more detailed view of structures within range.
This analysis will show coverage in a perfect world, with towers expected to reach a certain range. This challenge of accurate coverage can be mitigated by viewing your data in a 3D perspective.
Check out this webinar recording and see how adding the third dimension (3D) provides a better insight into the world around you.
Your next challenge will be pinpointing your next tower’s location.
Network Optimization
GIS can optimize your network’s coverage. In a GIS environment, you can propose site locations without investing thousands of dollars.
Your team can review proposed site locations using 3D and contour data in GIS Cloud. Combining these data sources will give you a better understanding of the terrain and the potential excavation needs for development.
If any site looks interesting, you can update your service coverage and gap analysis to confirm the improvements in the network. The low cost of a Map Editor license empowers you to make these decisions without risk.
Disaster Response and Support
Catastrophic weather mercilessly destroys critical infrastructure, including telecom towers. Responding quickly in these instances is crucial.
An online GIS solution can be the backbone for the support the community needs. A public portal can show the current situation and inform customers of any current outages.
The portal can also communicate to the public where temporary resources like telecommunication vehicles have been set up.
GIS Cloud can show where the most affected people are located and the optimal locations to stage resources.
Internally, a private portal can be used to Track personnel deployed to mitigate the situation. Maintaining the locations and statuses of these heroic individuals and teams will ensure everyone’s safety.
Conclusion
GIS can take your telecommunication network service to the next level. Digitizing historic assets empowers decision-makers and improves network operations.
A GIS-supported portal gives your customers important information on service outages and availability. A potential customer can locate their address in your portal and identify their options.
Our solution consultants are available to help you take the first steps toward a GIS supported network. If you’re tired of paying high legacy GIS costs, GIS Cloud may be just what you are looking for.