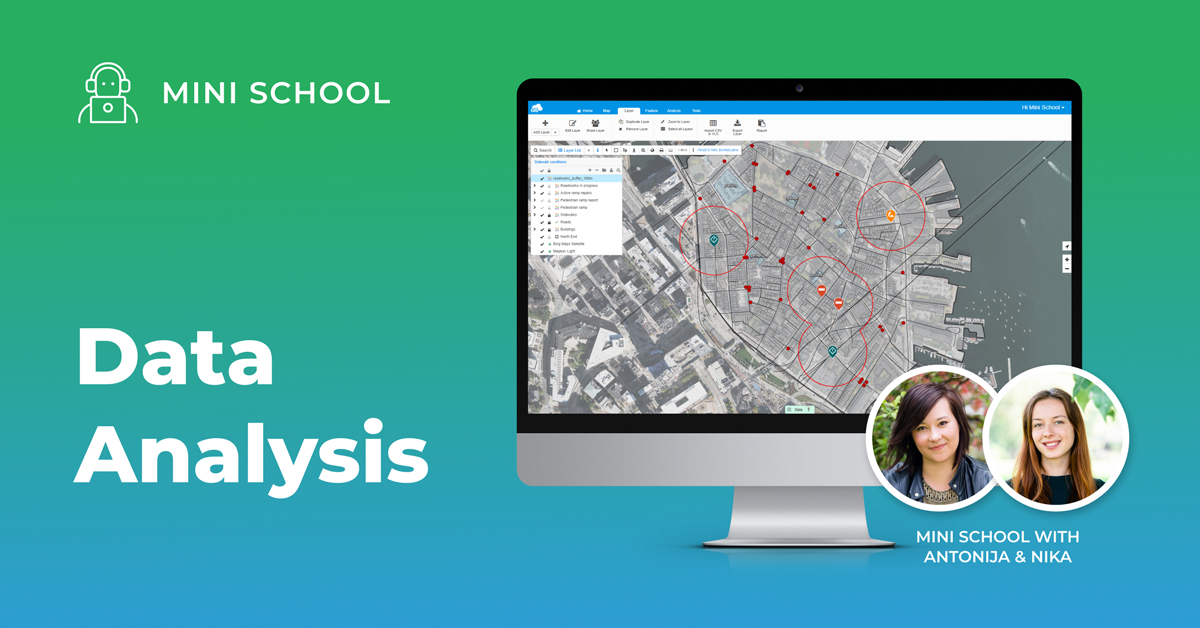
There is more to GIS than just visualizing the data you are working with. The real power lies in the ability to perform analysis and how to interpret the results for better planning and work optimization.
In the past, that kind of analysis was better off left to the specialists to work on. But, with GIS Cloud we wanted to show you how simple it is to get started with this and that you don’t need to be a GIS expert to manage your spatial data. The only important thing is understanding your data and what you want to achieve with it.
In this video, we put ourselves in the position of the analyst that was trying to optimize the data required by field workers to have better operational visibility. For that reason, we had to reduce the clutter of information residing on a map and only keep the relevant ones so that the field crew could manage their daily activities more efficiently.
For step-by-step guides, make sure to visit our manual here.
As always, we would be happy to hear from you, so feel free to send us an email at hello@giscloud.com, and we can help you with data visualization in your projects as well.
In the meantime, try some data visualization options yourself by signing in, or if you already haven’t, create your account and start using GIS Cloud today!
Give us some information about your work and get a personalized demo.
Oops! Something went wrong while submitting the form.

Mini School: Data Analysis
1 min read
Products
How it Works
Mobile Data Collection
Map Editor
Map Viewer
Map Portal
Crowdsourcing
Publisher for QGIS
Publisher for ArcMap
Geocoder
Terms of use & Privacy policy © GIS Cloud Ltd


