
The city of Amsterdam is the capital and most populous city in the Netherlands. It is considered to be an alpha world city by the Globalization and World Cities (GaWC) study group. With ranking 3rd in innovation by 2thinknow in the Innovation Cities Index in 2009, search for cloud computing solutions took its momentum in the Netherlands.
In their search for an easy cloud-based solution for the road workers to complete a comprehensive list of small maintenance works in district East, City of Amsterdam came across GIS Cloud. After getting to know the software, they found GIS Cloud solutions to be ‘exactly what they needed.’
The problems with the old workflow
The usual workflow for City of Amsterdam road workers consisted of a couple of steps. Their work would be plotted and mapped on PDF maps, one for each neighborhood. These maps in PDF format would then be viewed on Toughbook laptops. While this workflow worked fine, they noticed the maps were getting to be too big and clunky and registering the points in excel did not feel intuitive.
The City of Amsterdam needed:
- Ability to customize maps and forms from any device
- Possibility to access the maps on tablets (Android and iOS)
- Have all the features visible in one map
- Ability to follow the progress of road workers in real time from the office
The cloud-based GIS solution
The possibility of having highly customizable maps and forms allowed the City of Amsterdam to design a new online workflow. All the maintenance works could be viewed and analyzed in a single map created in Map Editor and was accessible on different devices. When work would be completed, with Mobile Data Collection app they could adjust the status, while the progress of their work could be followed online from the office. It also allowed Team manager to monitor the situation and present it to various stakeholders.
In the words of City of Amsterdam:
GIS Cloud provided us with a flexible package and the possibility to create all new workflows in an easy to use interface. The perfect solution.
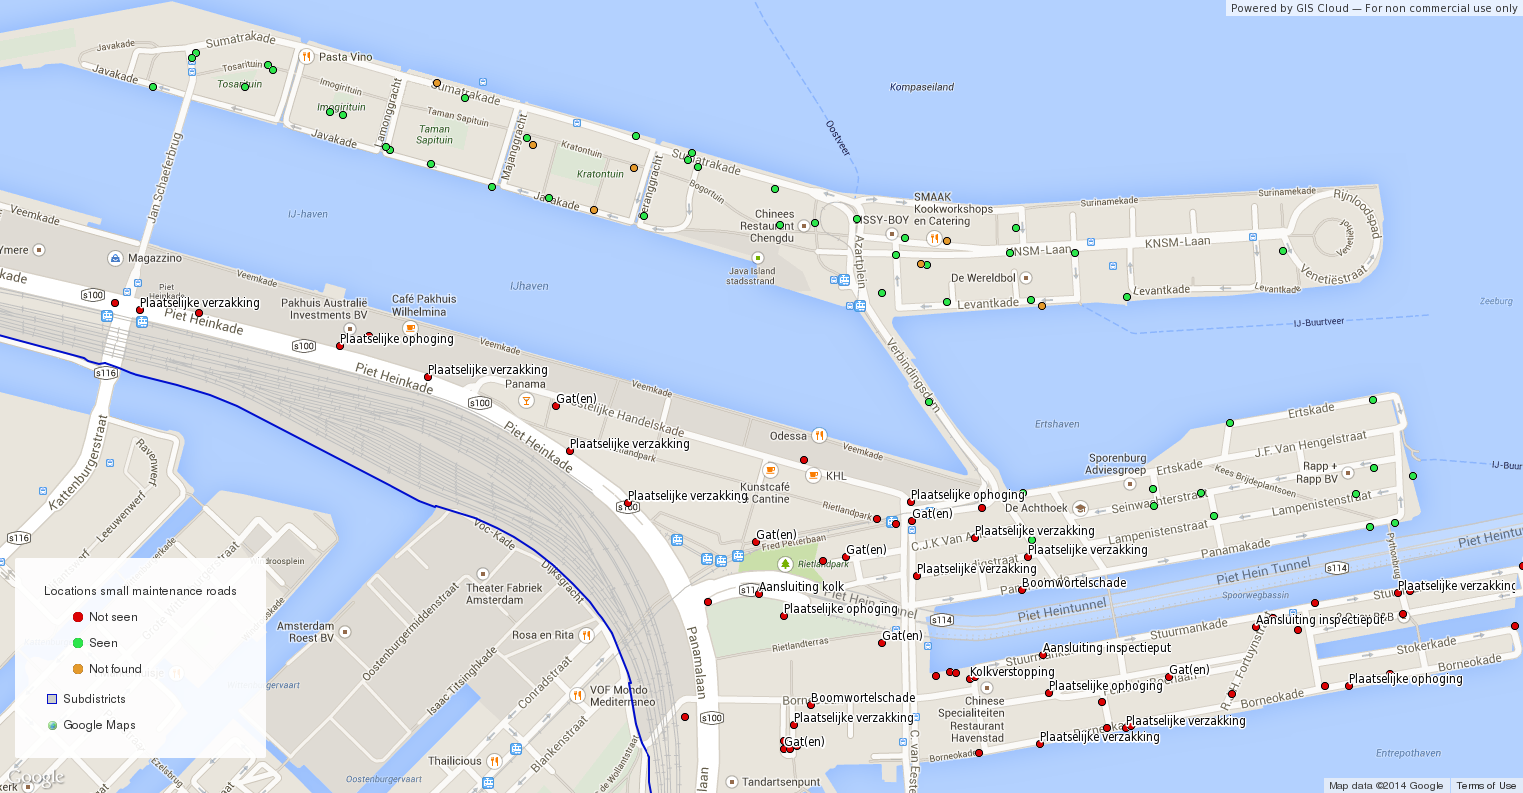
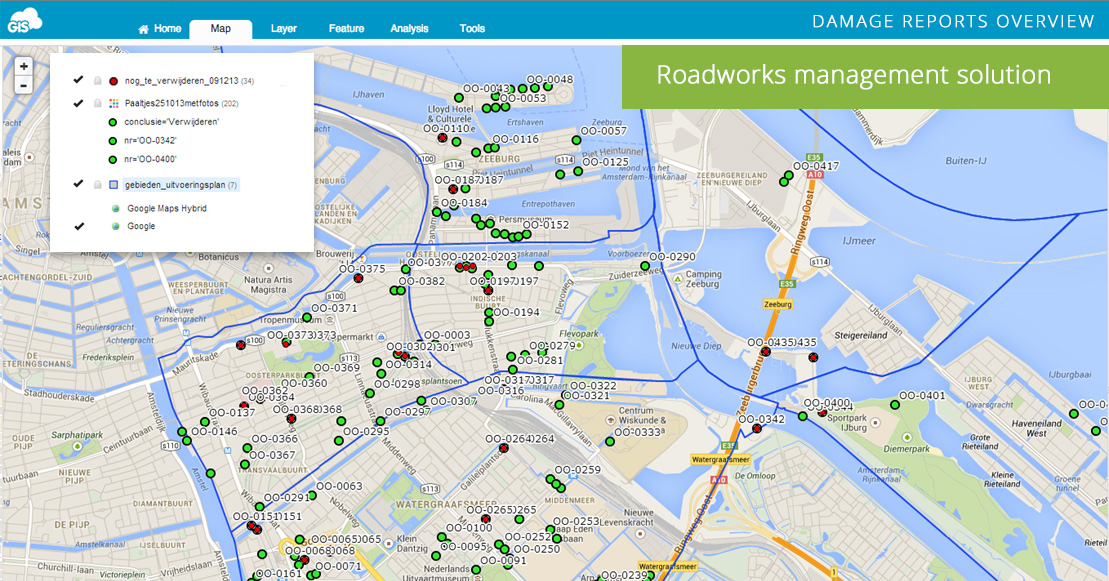
Overview of damage reports (wholes, tree root damage, damage by subsidence) done in the field and office, indicating the stage of each of the roadworks: not seen (red dot), seen (green dot) and not found (orange dot)
The Results
- Accurate and current information about roadworks that can be accessed from any device from the field or office in real time
- Set of customizable cloud tools for creating an online workflow for small maintenance works
- An interactive and user-friendly solution that allows road workers to be more efficient in their maintenance tasks
- Accessible online maps with interactive points for roadworks, viewable on tablets (Android and iOS) and phones
* Note that all the maps used for the last couple of case studies have been created using our upgraded Export Tool.