
The City of St. Louis Point-in-Time committee collects data about the homeless population as a part of the Point-in-Time Count project. They survey the entire city to establish a continuity of care for people experiencing homelessness. The field survey is a great deal of work so the committee wanted to improve day to day field operations. They choose the GIS Cloud solutions for field data collection.
People who experience homelessness are at risk of suffering adverse mental and physical health outcomes. Effective programs and services exist to help people move into more secure housing, address the concerns that contributed to homelessness, and live more fulfilling lives. Street outreach can be an useful activity for connecting persons experiencing homelessness to evidence-based programs, especially those persons who are suffering from chronic mental health concerns. Moreover, street outreach can only be effective as far as outreach workers know where to engage the people they hope to serve. To this end, the St. Louis City Continuum of Care (CoC), an association of homeless service providers, used GIS Cloud in its most recent Point-in-Time Count to inform providers of the distribution of homelessness in the region.
The Point-in-Time Count is federally mandated by the United States Department of Housing and Urban Development for all CoCs across the country, to determine the prevalence and characteristics of persons experiencing homelessness. Occurring across the country at the end of January, the count helps to determine how much federal funding for homeless services will be distributed to each CoC.
Challenges of street outreach
In St. Louis City, several teams canvass the entire city to survey persons experiencing homelessness. While this process allows the CoC to obtain information on the demographics of homelessness in the city, it becomes more difficult to follow-up with individuals, to establish continuity of care — providing consistent access to quality, cost-effective care.
Also, the usual paper-based data collection methods are not as efficient as the digital data collection process that enables having all data in one place and instantly syncs new information attaching it to a particular point on a map. Adding spatial dimension to the manually collected data that is later added to spreadsheets was yet another challenge, because better data visualization methods mean more efficiency, not just in data collection, but also in planning, prioritizing and coordinating actions that would improve the situation of the homeless people in St. Louis.
The GIS solution
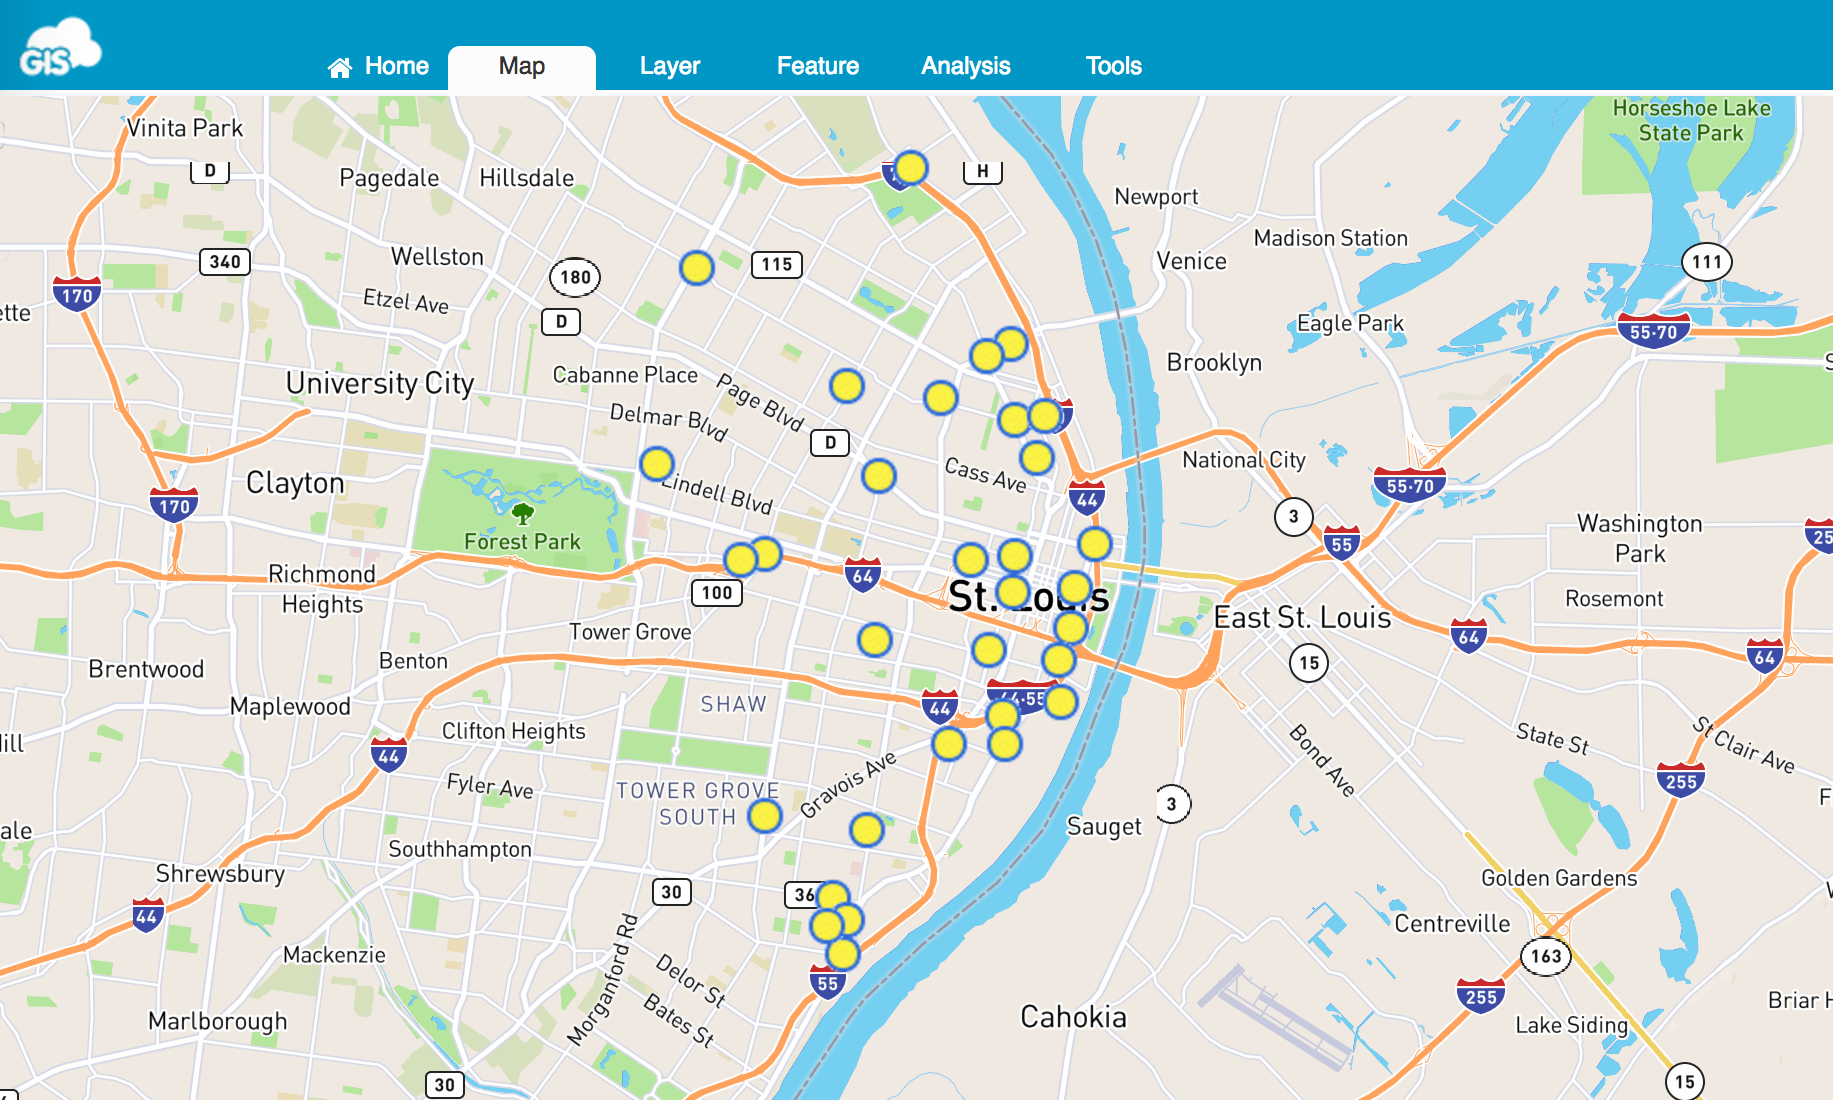
The integration of spatial data collection into Point-in-Time counts allows keeping the records about homeless persons in one place. It enables communities to devise data-driven approaches for creating homeless service initiatives in their areas. Moreover, spatial data collection addresses a common critique of Point-in-Time counts by making counts so much more than just a means to meet a federal mandate.
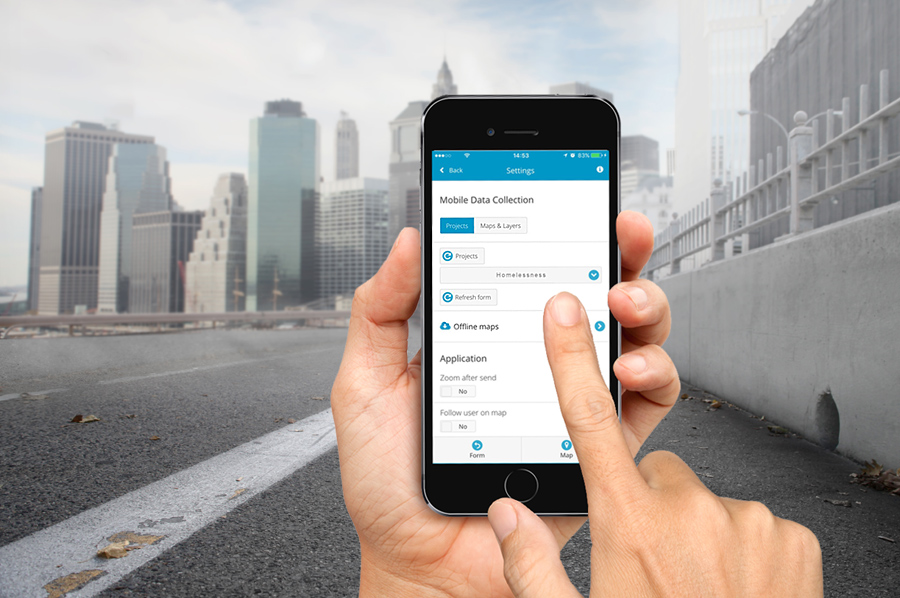
In the words of Kyle Miller, the count itself becomes a solution-based endeavor to determine areas of high need, plan future outreach initiatives, and establish new homeless services. The City of St. Louis Point-in-Time committee used the Mobile Data Collection and Map Editor app to make their data collection process more efficient while gaining an excellent tool for data visualization that enabled them to get more value from their field efforts and plan future actions.
Kyle Miller noted that after conducting a basic search of how other communities have integrated spatial data collection into their Point-in-Time count, the Point-in-Time committee discovered a past partnership between the GIS Cloud and another Midwestern city. Understanding the potential of the Mobile Data Collection application, it was clear that it could meet the needs of the CoC.
Through Mobile Data Collection, the City of St. Louis’s Point-in-Time committee will have a greater understanding of the spatial distribution of homelessness. The power of producing a snapshot of a transient phenomenon cannot be underestimated. The straight-forward design of the app made it accessible to most volunteers conducting the survey. As the committee continues to analyze the data, it is without a doubt that there will be future discoveries.
– Kyle Miller
The results
The St. Louis City Continuum of Care conducted its data collection on Thursday, January 26th from 4 am to 9 am. Each team was given the opportunity to use the Mobile Data Collection application when encountering a person experiencing homelessness. Having completed the count, the committee hopes to finalize data by the end of February. Data will be made available to the public through the St. Louis City Continuum of Care website. However, all the data will be presented in an aggregate form to protect the privacy of the persons interviewed. In the future, the committee intends to release a series of resources detailing the experience of organizing a Point-in-Time count, integrating spatial data collection into the count, and managing data once it has been collected.
Interested in trying out Mobile Data Collection for your project? Sign up here.